Silver Fractal Analysis Update
Commodities / Gold and Silver 2012 Sep 02, 2012 - 11:57 AM GMTBy: GoldRunner
 [Before reading this update on Fractal Silver, you might wish to skim through my recent public article, “Fractal Gold Review and Update” since it discusses key timing issues that this article is based upon.]
The Fractal Silver Chart from the late 70’s is a bit different than today, mostly due to the effect that the deflationary psychology of the current period has had on Silver as a partly “economic metal.” This means that the chart of Silver has been much more volatile, especially in downside corrections compared to the late 70’s charts. The Silver parabola is a less fluid form than the Gold parabola with Silver making sharp vertical rises along the way. The Gold and Silver parabolas are driven by the flows of Dollar Inflation to Devaluation, yet big money and Central Banks mostly invest in Gold. This leaves Gold’s little sister, Silver, more prone to volatility and to speculation. This fact can create an advantage for Silver investors.
The 70’s Silver Bull
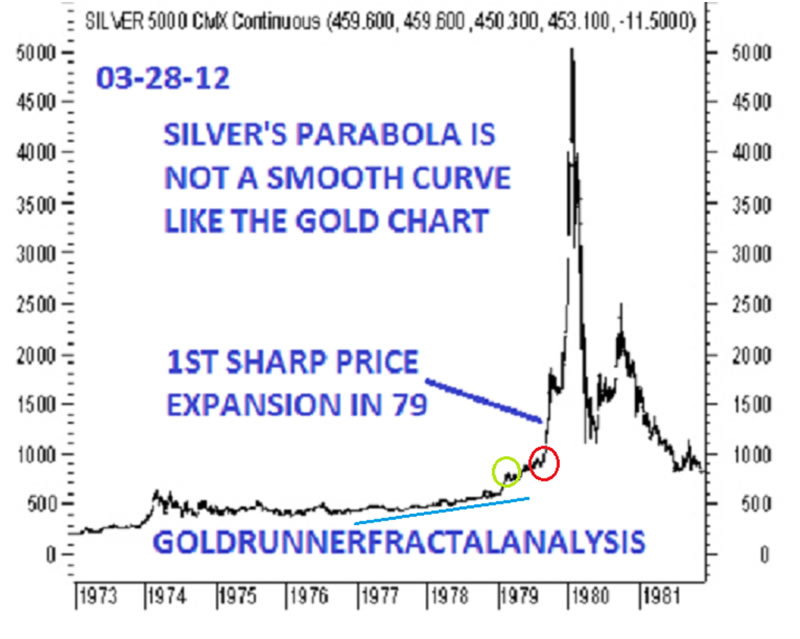
The first chart is an arithmetic chart of 70’s Silver. I have placed a blue angled line under the first portion of the late 70’s Silver Bull to show that Silver ran in an angled channel before its first thrust up to and above the 1975 high- the then historic high. I have drawn a green circle around the move up to the old high which likely corresponds to Silver’s run up in 2011 to the old 1980 high. Yet, going forward this creates “timing issues” compared to Fractal Gold so the red circle might fit the timing of the current point in the Silver Bull, better. The sharp rise out of that red circle appears to fit the type of move that we expect Gold to make, soon, based on the fundamentals where the Fed has already printed over $1.3 trillion while the markets have not yet devalued the US Dollar. At this point in the 70’s Gold appears to have doubled its log channel which is more in tune with the “1st sharp price expansion in 79” as noted on the chart.

The question at this time is, “Will Silver chop back up to the 2011 highs before busting sharply higher, or will Silver make a very sharp move higher out of this correction that appears to be terminating?” The jury is still out, but Fractal Gold suggests a sharp move sooner rather than later.
A simple ratio analysis for the rise up to the top above the red circle suggests that however we get there, the rise might well be 3 times the recent high, which could give us Silver to around $150. Yet, there are both higher and lower potential price targets to consider.
[Goldrunner maintains a subscription website at Goldrunnerfractalanalysis.com if you are interested. He will be starting a public free newsletter via e-mail during Labor Day week. If you are interested in the public newsletter, you can send an e-mail to GOLDRUNNERBLOG44@AOL.COM.]
The Current Log Silver Chart
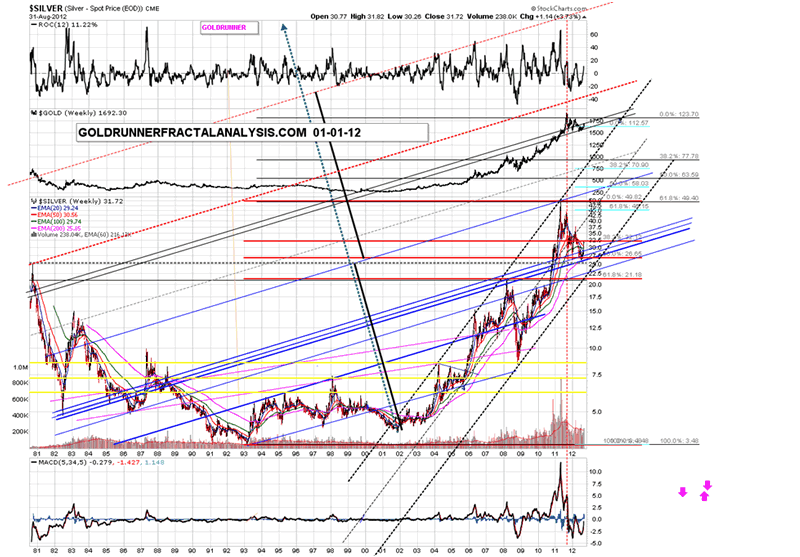
The next Silver Log Channel Chart was created way back in 2005. We can see that the 2011 rise in Silver topped at the top of the black channel, sand then Silver corrected down to the 3 blue angled support lines off of the previous high. A rise in Silver back up to the top of the black channel into the first half of 2013 would give Silver a price target in the mid to upper $80s. Thus, per the 70’s Silver chart, above, Silver could chop back up to the top of the channel into the first half of 2013.
If Silver rises more quickly due to a huge amount of Dollar Devaluation, then Silver could rise all the way up to the next resistance point at the double black lines by breaking out of the log channel. That target would be somewhere in the $115 to $125 range. Such a move would be an equal move on the log chart from the previous high up to the 2011 top. It would take a rocket shot up to the red line above the double black lines for Silver to run up to the $150+ level.

Take a look at the 70’s arithmetic Silver chart, above. Late in the Silver Bull, Silver made huge moves compared to the early low channel that contained it. Whether we are at the green circle or the red circle makes little difference- we have huge moves in Silver coming. Whether Silver chops higher before exploding, or whether it moves up very sharply from right here, is only a timing consideration to explosive Silver levels.
Personally, based on the fundamentals at hand and the fact that Gold doubled its log channel around this point in the cycle; I expect Silver to bust up out of its log channel in 2013. Will that happen in the first half of 2013? I don’t know, but it is certainly possible.
The Fed stating, “No more QE” while it was printing up over $1.3 trillion Dollars accomplished the task of continuing the constant acceleration of Dollar printing that must continue to stave off deflation, yet it has created a huge gap between Dollar fundamentals and Dollar value. Thus, should the Fed announce more QE going into the election, I suspect the markets will quickly play catch-up in terms of devaluing the Dollar for Dollars already printed, besides Dollars that will be printed going forward. $600 Billion printed in 2011 shot Gold up $600 and Silver up ~ $32. $1.3 trillion already printed is double that, AND I suspect the Fed is not done printing this year. This is the fundamental reason why Gold and Silver will likely fly into 2013.
As a final note, the above numbers don’t fall into the “bizarre camp” since Gold doubled its log channel around this point in the cycle back in the late 70’s while Silver went vertical. What if Silver were to double its log channel into 2013, even if it chopped higher for 6 months, first? That kind of target would blow $150 Silver out of the water. I won’t mention that potential number, here, but we have laid out that “bizarre possibility” for subscribers.
Personally, I will bide my time and look for Silver to reach the $60 to $68 level, first. Yet, I will hold open the possibility for Silver to do much more on the upside as the 70’s Silver Chart reflects.
For the moment,
Goldrunner
NOTE: A link to the Goldrunner subscription service can be found here. If you would like to be added to Goldrunner's mailing list to receive his new and Free newsletter, Goldrunner's Fractal Corner, send an e-mail to GOLDRUNNERBLOG44@AOL.COM.
Please understand that the above is just the opinion of a small fish in a large sea. None of the above is intended as investment advice, but merely an opinion of the potential of what might be. Simply put: The above is a matter of opinion and is not intended as investment advice. Information and analysis above are derived from sources and utilizing methods believed reliable, but we cannot accept responsibility for any trading losses you may incur as a result of this analysis. Comments within the text should not be construed as specific recommendations to buy or sell securities. Individuals should consult with their broker and personal financial advisors before engaging in any trading activities. Do your own due diligence regarding personal investment decisions. In the interest of full disclosure, GOLDRUNNER is personally invested in the Precious Metals sector including various Precious Metals and other individual stocks. GOLDRUNNER reserves the right to modify or eliminate any or all positions at any point in time.
© 2005-2022 http://www.MarketOracle.co.uk - The Market Oracle is a FREE Daily Financial Markets Analysis & Forecasting online publication.


