Dividend Paying Growth Stocks Can Provide Retirees Great Total Returns
Companies / Dividends Aug 30, 2012 - 03:56 AM GMT When people talk about dividend paying stocks, their focus is often on the dividend income they provide. This is especially true for the investors that fancy themselves purists as dividend growth investors, who seemingly care more about their dividends than they do their capital. However, this article intends to illustrate that dividend growth stocks are not only great income vehicles for retirees; they can also be terrific vehicles for providing total return.
However, to understand this fully you must first consider that dividend paying common stocks come in all sizes, shapes and flavors. Therefore, some are better for current yield, some are better for a growing income stream and others offer the total package of growth and income. Furthermore, there are many nuances and degrees of growth and/or income that various classes of dividend paying stocks possess. In other words, you can’t paint all dividend growth stocks with the same general brush.
Additionally, there are certain attributes, characteristics and relationships between growth and income that various types of dividend paying stocks can have. Generally speaking, although exceptions can be found, the higher the yield, the lower the growth you can expect, and vice versa. In other words, dividend seeking investors are often faced with a trade-off between growth and income.
Invest According to Your Personal Goals, Needs and Objectives
Therefore, the specific needs, goals and objectives of the individual investor can, and should be, the driving factors in determining what class of dividend paying stocks they should embrace. The amount of time the investor has before retirement is another important factor when deciding what type of dividend paying stock to choose. The investor with a long-time horizon might be prudent to opt for higher growth and lower current yield, whereas the investor that is already in retirement, or very close to it, might desire yield over growth.
These are very personal decisions, and there is no right or wrong answer. Once again, it all comes down to the individual investor’s specific situation and the amount of time they have left to invest before they might need to start taking distributions. Risk, or maybe better said, the individual’s tolerance for risk, is another crucial piece of the puzzle. Nevertheless, and regardless of each individual situation, the better the investor understands the nuances, characteristics and attributes of the many different classes of dividend paying stocks, the better equipped they are to make the correct decisions.
Dividend Growth Stocks For Total Return
With the above introductory remarks and positioning statements made, the primary thrust of this article is to illustrate that dividend paying stocks, when done correctly, can generate great total returns to fund future retirement with. Although the focus is often mostly on the dividend income, for many dividend paying stocks it is merely the icing on the cake. Whereas the cake is the capital appreciation component that is often overlooked in favor of the yield. Yet, capital appreciation, although perhaps less certain, usually ends up providing the majority of total return. Our statement that capital appreciation is the cake is based on the total investment return that the business (stock) provides in its own right. In other words, it does not consider the reinvestment of dividends because that would represent an extraneous source of return. When you receive a dividend, it is now your money and no longer attached to the stock. Therefore, you can do what you wish with that money. This could include spend it, reinvest it back into the same stock, reinvest it into a different stock, or whatever you choose to do with it.
Therefore, we believe the fairest and most enlightening way to evaluate total return is by analyzing each component separately and independently. In this manner you can clearly ascertain where and by what magnitude each component, capital appreciation and dividend income, contributes in their own right. In other words, we will look at total returns over reasonably long time frames and calculate how much of a return comes from the dividend and how much of the return comes from the capital appreciation.
Reinvesting dividends may be a great way to compound wealth, but it does not relate to the return that the actual entity itself produces. Once again, we will produce performance results on dividend stocks where the capital appreciation component is presented separate from, but along with, the dividend component. In this manner, the reader can see exactly how much return specifically comes from the dividend versus exactly how much return comes from capital appreciation. There is no muddy water when presented in this way.
Both Income And Capital Appreciation Are Highly Dependent Upon Valuation
It is important for the reader to understand that the principles presented with this article are predicated on investing in dividend growth stocks when valuations make sense. Therefore, each example we present will be measured starting from a point in time when the stock was fairly valued. Therefore, we are excluding to the maximum extent possible, the anomalous pricing behavior that the market often conjures up. In other words, we are identifying either overvaluation or undervaluation as aberrant pricing behavior.
The following examples will review four types of dividend paying stocks. We will start with high-growth and moderate yield, followed by above-average growth with a stronger yield, then an example of an average grower, and finally a low growth higher yield example. With each of these samples, our focus is on their total return capability and on how much of it comes from growth of capital versus dividend income in the long run. Additionally, the reader should understand that these four examples represent just a few, but certainly not all of the many nuances and variations of dividend growth stocks available.
Furthermore, with this article, we intend to provide additional evidence of our thesis that the market capitalizes earnings based on the company’s earnings growth rate independent of whether the company pays a dividend or not. Therefore, if a company does pay a dividend, the dividend will represent in essence a bonus or additional return over the non dividend paying company with equal growth. For a more detailed look at this thesis, follow this link to our previous article.
Building The Total Return Case One Step At A Time
Once again, we’re going to rely on the F.A.S.T. Graphs™ fundamentals analyzer software tool to illustrate truths about total return based on capital appreciation plus dividends. Moreover, in order to illustrate the primary principles underpinning our thesis, we will build our first example graph one step at a time.
Syngenta (SYT) Earnings Only
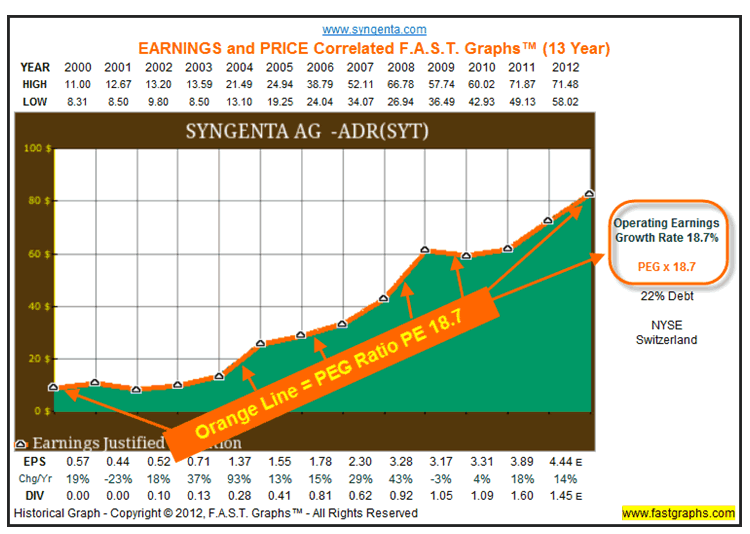
Our first example looks at Syngenta, a very fast-growing Switzerland-based company engaged in production of products for crop productivity. Syngenta is an ADR and went public in late calendar year 2000. The following F.A.S.T. Graphs™ plots their historical record of earnings growth only (the orange line and green shaded area), since they went public. To be clear, this first graph shows no dividends, price or performance.
When earnings are viewed in isolation like this, we see that Syngenta is clearly a strong business that has grown earnings in excess of 18% per annum since they went public. Furthermore, the company has little debt on the balance sheet. Therefore, based on earnings alone, Syngenta looks like an excellent candidate for capital appreciation.
Syngenta - Earnings And Price Correlated Graph
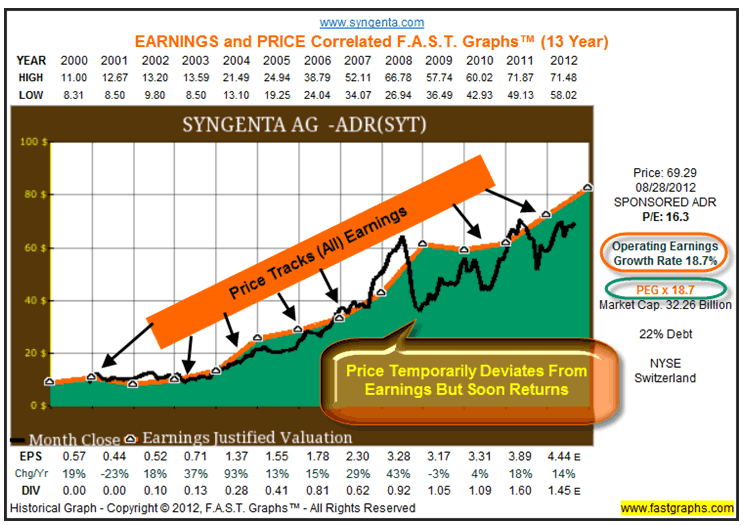
With this next look at Syngenta, we add monthly closing stock prices to the equation (the black line). Here we learn that the company’s stock price has closely tracked earnings. Moreover, during the short periods of time where price deviated from the earnings justified valuation, it soon returned to fair value. With price tracking earnings so closely, we can safely assume just by looking at the graphic that shareholder capital appreciation should closely correlate to the company’s earnings growth of 18.7%.
Note that since earnings growth for Syngenta exceeded 15% per annum, the PEG (PE equals earnings growth rate) formula for valuing a business is used to determine fair value (color-coded in orange ink to the right of the graph). In other words, in this high-growth example the orange line represents a PE ratio of 18.7. Consequently, we can see that the market has historically priced this stock close to its fair value PE, more or less.
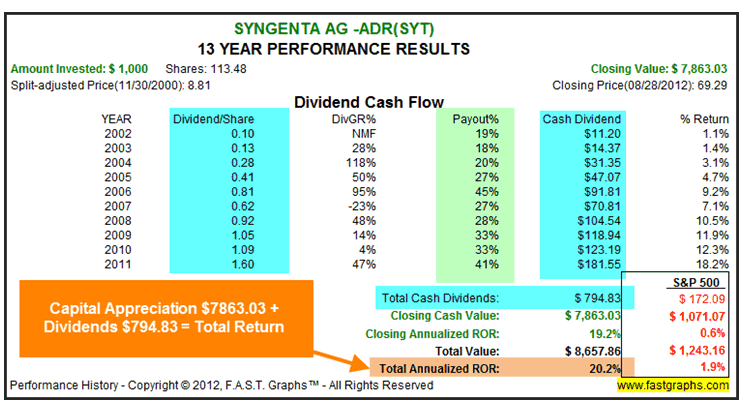
The following performance table calculates the capital appreciation component of Syngenta based solely on the market pricing its earnings. When looked at from this perspective, we see that 19.2% capital appreciation closely correlates to the company’s 18.7% growth rate. However, as we will soon see, this company does pay a dividend.
Therefore, the reader should recognize that the following performance results are only looking at the capital appreciation component. In other words, the stock was bought on 11/30/2000 at $8.81 a share and currently is priced at $69.29. Therefore $1000 originally invested grew to $7,863.03 generating capital appreciation of 19.2% per annum.

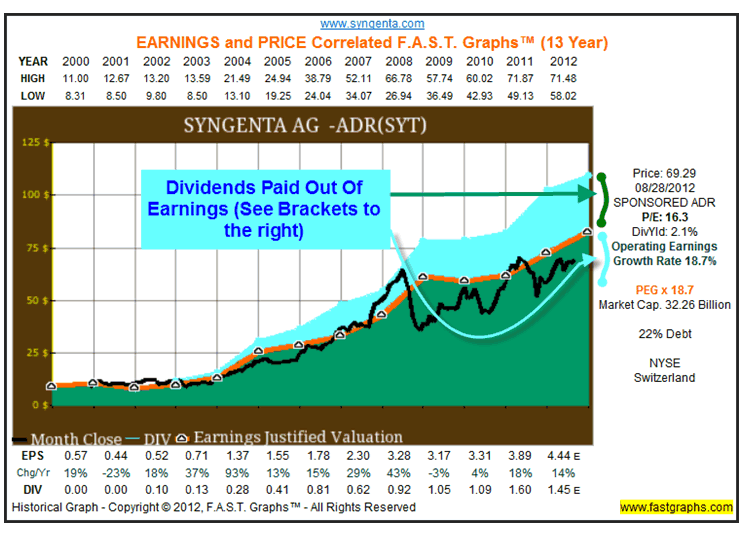
With our next graph we introduce the dividend component. The light blue shaded area on the graph below indicates dividends that are paid out of the green shaded earnings. When stacked on top like this we are provided a clear visual perspective of not only the fact that the company pays a dividend, but also its payout ratio. In other words, in this example the light blue shaded area represents approximately a third of the green shaded area, thereby indicating a payout ratio in the 30% to 35% range (the brackets to the right illustrate dividends paid out of earnings providing a visual perspective of the company’s payout ratio).
Now that we have all the pieces, our capital appreciation component and our dividend component, we can calculate and analyze total return and its sources. First of all, we discover that our $1000 original investment has grown into $7863.03. Therefore, the simple math says that capital appreciation contributed $6,863.03 ($7863.03 minus $1000 original investment). Once again, this capital appreciation component only, generated a 19.2% compounded annual return for Syngenta’s long-term shareholders.
Since we have included dividends, the performance report now provides a dividend cash flow table that allows us to examine dividends and their contribution to our total return. Here we discover that our original $1000 investment received a total of $794.83 of cumulative dividends (note that FAST Graph™ does not include partial year dividends, therefore, no dividends have been recorded for 2012). Add these dividends to our capital appreciation component and we discover that our $1000 original investment provided a cumulative ending value of $8657.86. Therefore, our total annualized return comprised of capital appreciation and dividend income is 20.2% per annum.
However, the important point here is that with this high-growth example, capital appreciation produced the lion’s share of total return. On the other hand, this does not diminish the value of dividends at all. The dividends generated from this high-growth, relatively low payout ratio, dividend growth stock, returned close to 80% of our original investment in cash. Not too shabby.
OGE Energy Corp (OGE) Above-Average Earnings Growth
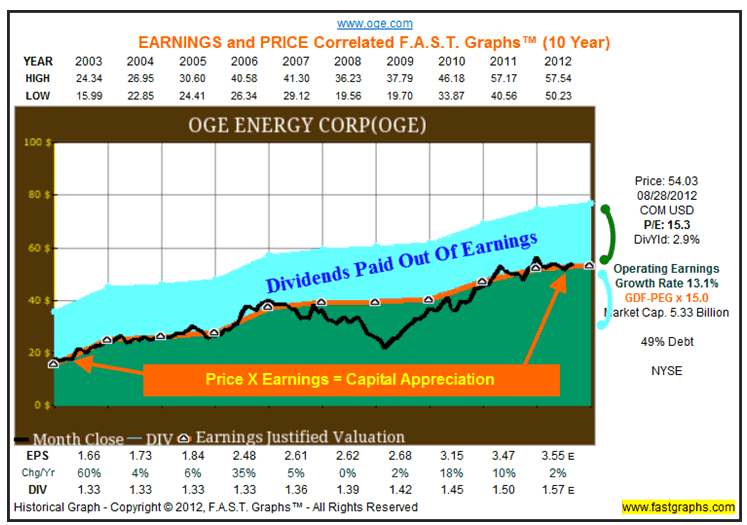
Our second example reviews the historical performance of OGE Energy Corp, a moderately fast-growing (less than 15% per annum) utility stock. We chose this example because we feel that it represents the quintessential visual depiction of the two components of return, capital appreciation plus dividends income.
With this example over this time period we see that stock price has tracked and valued the full measure of OGE Energy Corp’s earnings since 2003 (price tracks the orange line). Moreover, the company was approximately in value at the beginning of this timeframe and approximately in value at the end, therefore, valuation bias is mitigated.
The light blue shaded area shows us that the company has a high payout ratio (see color-coded brackets to the right of the graph). However, the price tracking the orange line shows that all of the company’s earnings were capitalized by the market, including these dividends that were paid out. Otherwise, the price line would be tracking significantly below the orange line. This is clear evidence that all the company’s earnings generated capital appreciation for their shareholders. The market applies a PE ratio, and not a PE minus dividends ratio.
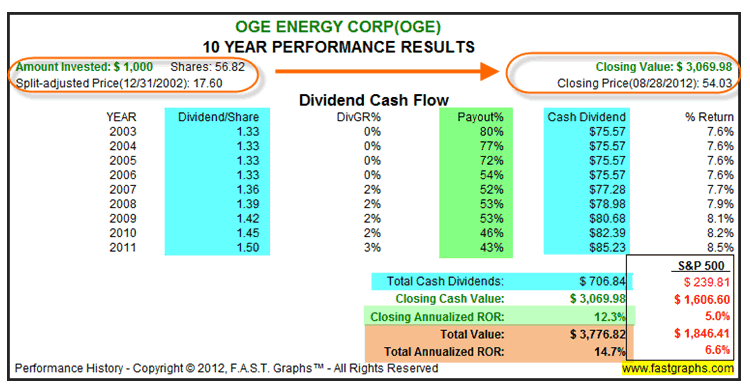
When we review the performance of OGE Energy Corp., we see that capital appreciation of 12.3% closely approximates the 13.1% historical earnings growth rate. Moreover, we see that dividends provided a nice return kicker. However, a very interesting fact about OGE Energy Corp. is that despite their strong earnings growth, their dividend growth rate has been very low from 0% growth to 2% growth and a maximum of 3% growth.
This may be an indication that the company does require retaining a portion of earnings to fund their above-average growth rate. However, that is not the real point of this article. This article is about analyzing total return and its sources. With this example $2069.98 of capital appreciation based on earnings growth, and $706.84 of dividend income. Therefore, we continue to see the magnitude and importance of the capital appreciation component.
VF Corp (VFC) - Average To Moderately Above-Average Earnings Growth
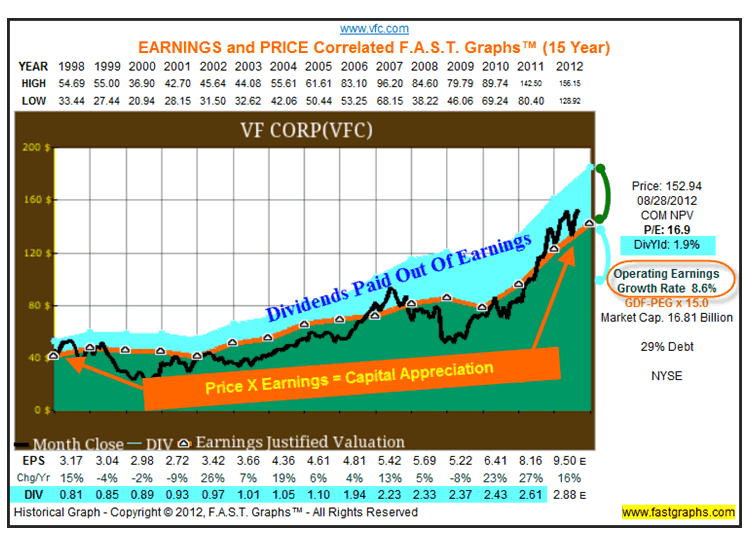
As dividend growth stocks go, VF Corp has produced a moderate earnings growth rate of 8.6%. Once again, we see an example where the market has capitalized the full measure of this company’s earnings growth. In other words, the stock price has tracked and correlated to the orange earnings justified valuation line. Furthermore, the light blue shaded area representing dividends visually indicates a payout ratio in the 25% to 40% area. VF Corp offers a moderate but growing dividend yield of 1.9%.
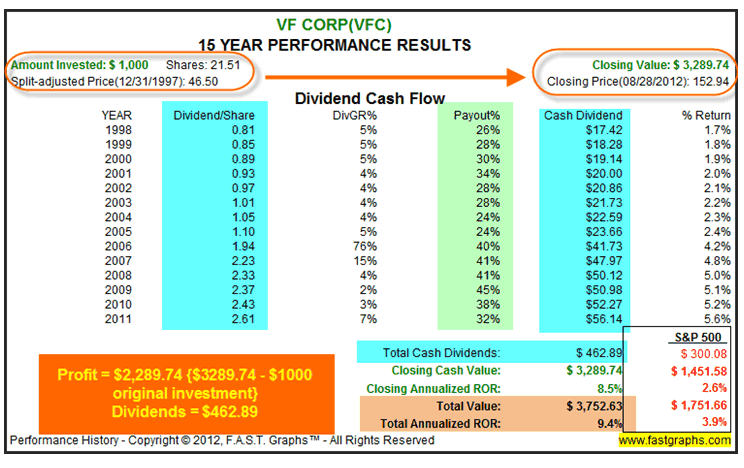
When reviewing the performance in this example we again see a very high correlation between capital appreciation and earnings growth. The company’s closing annualized rate of return (capital appreciation) over this 15-year timeframe averaged 8.3% which closely matches its 8.6% earnings growth rate. Once again, we see capital appreciation of $2289.74 ($1000 grew to $3289.74 equaling a $2289.74 profit).
Total cumulative dividends since 1998 equal $462.89. Therefore, we have further evidence of why we state that capital appreciation is the cake while dividend income is the icing. Although the dividend income is significant (and certainly nothing to sneeze at), it nevertheless is dwarfed in relation to the capital appreciation component.
HJ Heinz Co (HNZ) Low Growth Higher Yield
Our final example looks at HJ Heinz Co that represents a low earnings growth example averaging only 4.8% per annum and a higher yield currently at 3.6%. Just as with each of the other three examples, HJ Heinz Co’s stock price tracks earnings. Furthermore, by looking at the light blue shaded area we immediately see a high payout ratio (see performance table below).
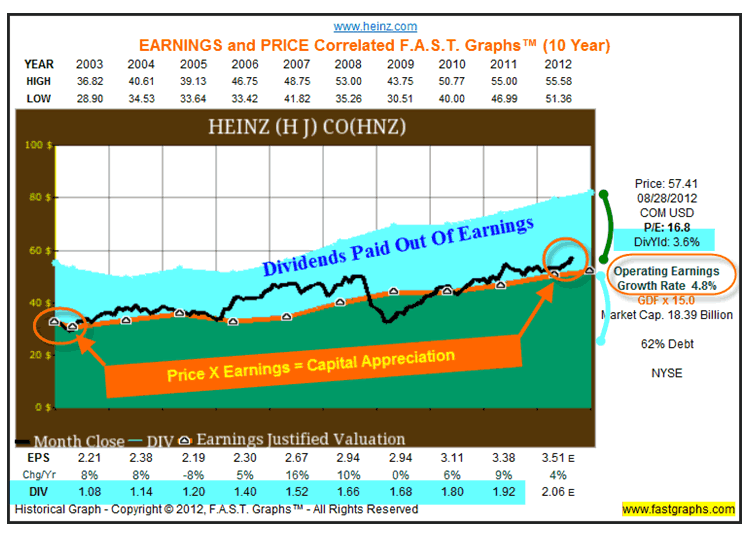
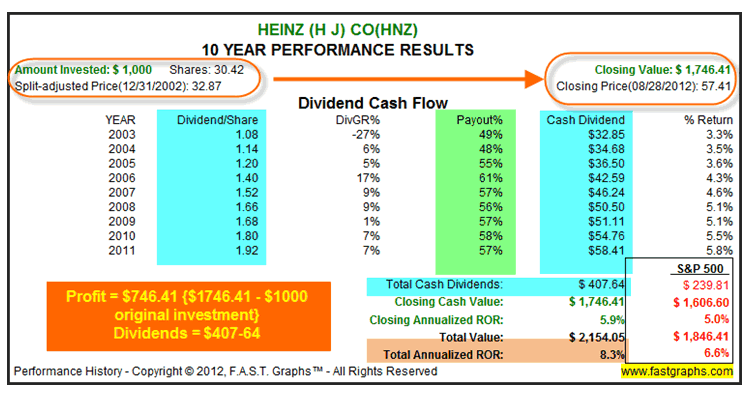
HJ Heinz Co’s performance results offer up a lesson in total return. With a low growth company, capital appreciation is going to be less than we would expect from a faster growing company. Consequently, we see that over this 10 year period that Heinz grew a $1000 initial investment into $1746.41 for a 5.9% annual return. In other words, HJ Heinz Co’s stock generated $746.41 of profit.
Dividends on the other hand equaled $407.64 cumulative since 2003 up through year-end 2011 on a $1000 investment. Consequently, although the dividend component was still lower than the capital appreciation component, they did represent a much higher percentage of the total return. To be clear, a low growth, high yield dividend stock will show a higher portion of total return from dividends than a higher growth example would.
Summary and Conclusions
This article is offered to illustrate the potential total returns that can be received by investing in high-quality dividend growth stocks purchased at sound valuations. The major underlying theme here is that total return is a function of valuation, earnings growth, dividends and dividend growth for dividend paying stocks. For non-dividend paying stocks, total return will be a function of earnings growth adjusted by valuation.
Although we understand that many of our dividend growth investing friends prefer to ignore capital appreciation in favor of dividend income, we are hopeful that this article enhances their appreciation for appreciation. Another way of looking at this is that if your asset base is large enough that you can live off your dividend income, then it makes some sense that you might not worry too much about your capital’s growth. But isn’t it nice to know that solid capital growth is a potential side effect of a good dividend growth stock portfolio?
Moreover, isn’t it nice to know that long-term capital appreciation, although perhaps less certain than dividend growth, will in most cases be much greater than your cumulative dividend income? Frankly, we believe that a well researched portfolio of high-quality dividend growth stocks purchased at sound valuations provide a high probability for a secure and comfortable retirement. Of course, continuous due diligence and monitoring is required. And believe it or not, the most exciting part of this recipe is the high capital appreciation potential.
Finally, this article attempted to illustrate the many variations that comprise the dividend growth stock universe. Although we only showed a few examples, there are many sizes, shapes and flavors of dividend growth stocks out there. Some offer higher growth and less income, some offer higher income and less growth and just about everything in between. The secret is to properly evaluate each potential candidate based on its own merits and attributes. We believe this is a job that is best done one dividend growth stock at a time.
Disclosure: Long VFC and HNZ at the time of writing.By Chuck Carnevale
Charles (Chuck) C. Carnevale is the creator of F.A.S.T. Graphs™. Chuck is also co-founder of an investment management firm. He has been working in the securities industry since 1970: he has been a partner with a private NYSE member firm, the President of a NASD firm, Vice President and Regional Marketing Director for a major AMEX listed company, and an Associate Vice President and Investment Consulting Services Coordinator for a major NYSE member firm.
Prior to forming his own investment firm, he was a partner in a 30-year-old established registered investment advisory in Tampa, Florida. Chuck holds a Bachelor of Science in Economics and Finance from the University of Tampa. Chuck is a sought-after public speaker who is very passionate about spreading the critical message of prudence in money management. Chuck is a Veteran of the Vietnam War and was awarded both the Bronze Star and the Vietnam Honor Medal.
© 2012 Copyright Charles (Chuck) C. Carnevale - All Rights Reserved Disclaimer: The above is a matter of opinion provided for general information purposes only and is not intended as investment advice. Information and analysis above are derived from sources and utilising methods believed to be reliable, but we cannot accept responsibility for any losses you may incur as a result of this analysis. Individuals should consult with their personal financial advisors.
© 2005-2022 http://www.MarketOracle.co.uk - The Market Oracle is a FREE Daily Financial Markets Analysis & Forecasting online publication.


