


Gold Stocks New Cyclical Bull Market Underway
Commodities / Gold & Silver Stocks Aug 27, 2012 - 02:30 AM GMTBy: Jordan_Roy_Byrne

 Three weeks ago we wrote that the short-term outlook in precious metals was bullish. Quoting our conclusion: "The bottom line is this sector is very close to a breakout which would likely confirm the May bottom. The price action has started to improve and the sector has not been deterred by the aforementioned bad news which, in normal conditions would have caused a selloff. In the meantime, the public has been bearish the entire year and the dumb money has started to exit the market. It is this combination of factors that lead us to a firm bullish posture over the rest of the summer." In terms of weekly closing prices, GDX and SIL closed last week at a four month high, while GDXJ closed last week at a three month high. Silver closed at a four month high while Gold closed at a five month high. From that it would seem that these markets are overbought. However, a quick study of the long-term charts, sentiment and valuations confirms that we are in an absolute sweet spot. Markets have bottomed, a new cyclical bull has begun and there is substantial room to move over the coming months and year.
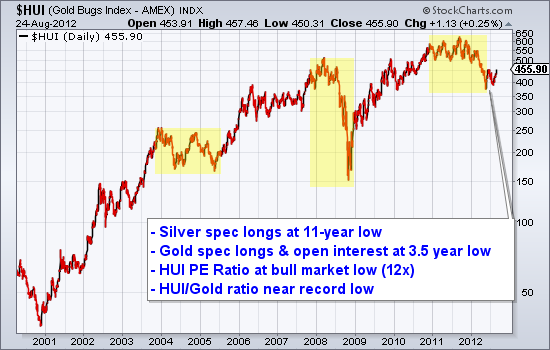
We begin with a chart of the bull market in the HUI and we highlight the cyclical bear markets. The 2011-2012 bear lasted about as long as the 2004-2005 bear but was a bit deeper (42% versus 36%). The fact that this bear corrected the recovery from the 2008 crash could be why various valuation and sentiment indicators are at such compelling levels (as annotated in the chart).
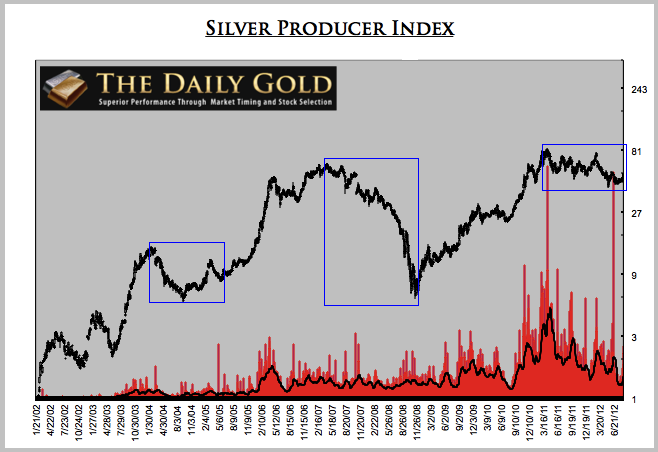
Next we chart our proprietary Silver index, which is comprised of 10 "growth oriented producers." (The ETF SIL only has a few years of history). This index corrected 60% in 2004, 90% in 2007-2008 and 50% from 2011-2012. The current bear market was the almost the longest (short of the 2007-2008 bear) but the smallest with only a 50% correction. Yes, to say only 50% is ironic but in looking at the chart one can see that the correction appears to be quite routine. This chart has potential to be a cup and handle pattern which could have massive bullish implications for the next few years.
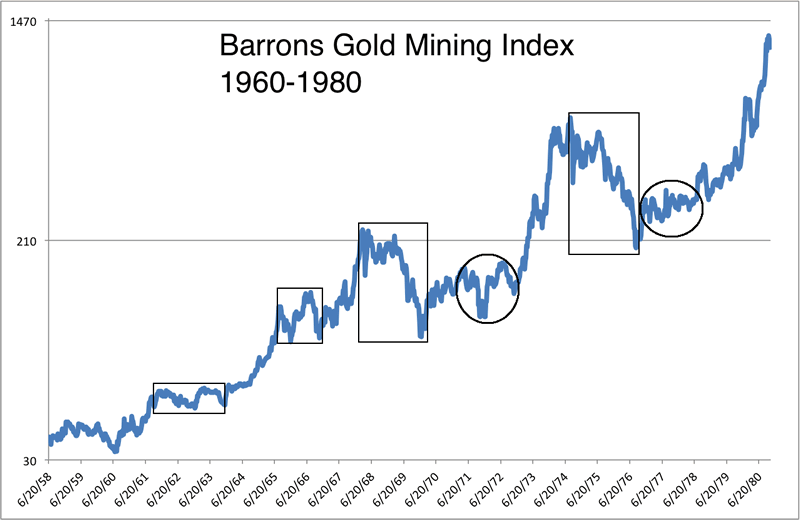
How does this bull market compare to the past? The Barrons Gold Mining Index (BGMI) had two tiny cyclical bears and two large cyclical bears. The circles show consolidations within cyclical bulls which lasted more than three years.
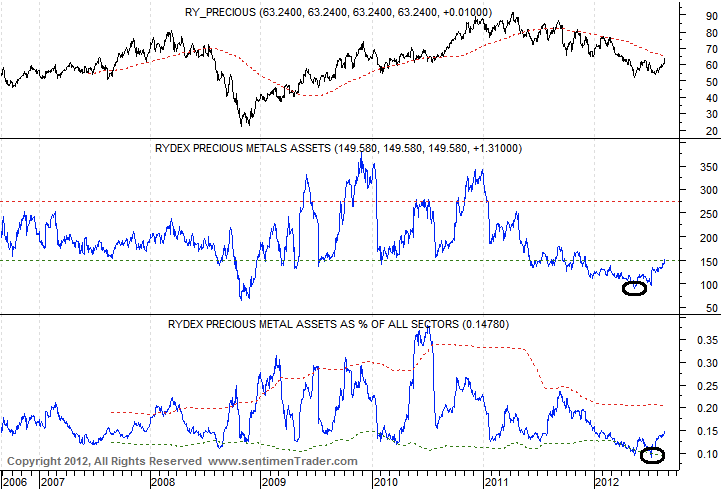
Visually we can understand why the sector is beginning a new cyclical bull market. Yet let's take a look at some simple sentiment and valuation data. Below we show info from SentimenTrader which shows the Rydex Precious Metals Fund. At the recent bottom, the assets were the lowest they've been since 2008. In fact, going back 10 years, it was the second lowest point (with 2008 being first). Also note that the precious metals assets (as a percentage of all Rydex funds) were at a minimum of a six year low.
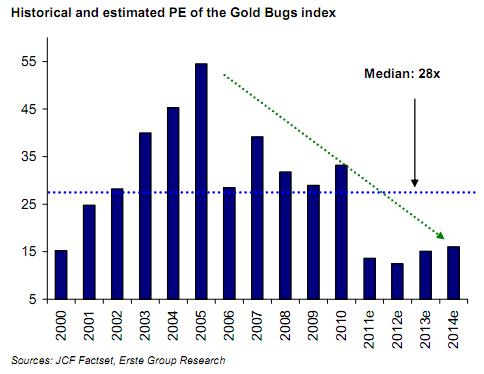
Next, we've shown this before but it's worth showing again. We calculated that the PE ratio of the HUI Gold Bugs Index at the May low was 12x earnings. This chart from the Erste Group displays the year by year PE of the HUI. If Gold moves higher then earnings should increase. Combine that with rising valuations and that explains the potential for substantial gains.
The confirmation of the bottom is obvious. Now what? Well, the question is if the sector will continue to zoom higher similar to 2005 and 2009 or if it will consolidate for months (similar to 1972 and 1977) before making a parabolic advance in less than two years. In any event, that is just semantics and for the hyper traders out there. In either scenario we are early in a new cyclical bull and there is tremendous opportunity to be had.
If you'd be interested in professional guidance in this endeavor, then we invite you to learn more about our service.
Good Luck!
© 2005-2022 http://www.MarketOracle.co.uk - The Market Oracle is a FREE Daily Financial Markets Analysis & Forecasting online publication.