Gold and the $600 Billion Question
Commodities / Gold and Silver 2012 Aug 24, 2012 - 05:57 AM GMTBy: Clif_Droke

 After spending the better part of three months locked in a lateral range, gold finally broke out on Aug. 21 and went on to make a series of follow-through highs. December gold was quoted at $1,667 as of this writing, its highest level since early May. The move came as many investors assume the Fed is about to stimulate the economy.
The basis behind this assumption came from the recently released minutes from the U.S. Federal Reserve’s latest meeting, which showed that “many members” of the Fed's Open Market Committee felt that additional action would be warranted unless the economic recovery shows “substantial and sustainable strengthening.” The minutes also showed that many officials favored pushing any increase in short-term interest rates beyond the Fed's current target of late 2014. Many economists believe the target will be pushed to mid-2015.
All summer, pundits on both sides have been complaining that the U.S. economy is “lousy” and in danger of sliding into yet another recession. The actual numbers haven’t exactly presented a rosy picture, but neither have they been all that bad. The economic recovery that began in 2009 hasn’t been particularly robust, and we’ve never recovered pre-crisis levels of growth. But as I’ve long maintained, the overall domestic economy has been slowly on the mend since the stock market recovery of 2009 began.
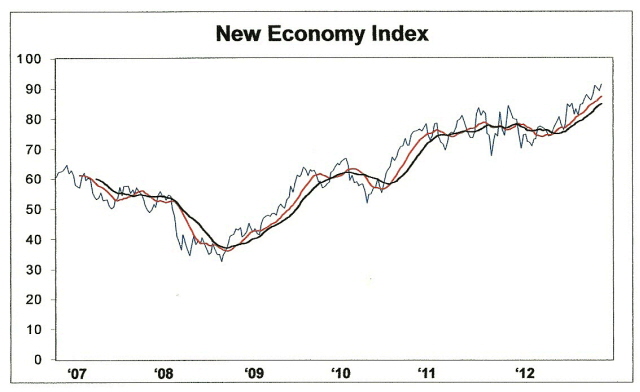
Moreover, consumer spending this year in some markets has been through the roof. Granted, much of the action has been along the high-end of the economy (e.g. luxury auto sales, jewelry, prime real estate, etc.) But even John Q. Public can’t deny it has done its share of spending at some point this year, as sales numbers from companies like Apple will attest. And as I keep reminding you to the point of being a nuisance, the New Economy Index (NEI) has recently hit an all-time high. This is one of the simplest ways I know of measuring the actual strength of sales transactions taking place across the U.S. retail economy.

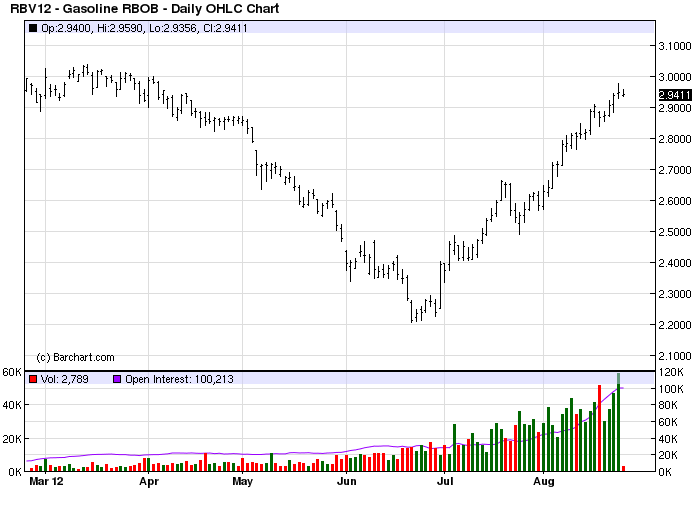
How anyone can look at that chart, then look at some of the economic data available and come up with the conclusion that we desperately need another quantitative easing (QE) from the Fed is beyond me. What I simply can’t accept is that a man of Ben Bernanke’s intelligence, not to mention breadth of economic history, would be so foolish as to risk runaway commodities inflation at a critical moment in the recovery. If we examine the facts I think we can agree that Bernanke’s hand has already been dealt by the market itself and he can do nothing now but stand pat. Chart exhibit number one is the price of gasoline futures shown below.

Although consumers haven’t started howling yet, if the pump price continues rising beyond summer it could put a serious dent in the NEI chart we just looked at. It would also do much to raise the overall consumer inflation rate since everything depends on transportation. This alone would give the Fed pause for loosening, especially when it has been shown that each new quantitative easing initiative fed directly into higher petroleum prices. Ask yourself, “Can this economy continue to recover on a gas price higher than $4/gallon?” Rest assured this is the same question Bernanke is asking himself.
I maintain that one of the main things Bernanke uses as a barometer of the success, or failure, of Fed money policy is the stock market. Bernanke has all but admitted this past testimony. He looks at how the S&P, the NASDAQ, the Russell 2000 and other indices are performing. When he seems the indices making new highs, he’s assured that his money policy is working insofar as it was designed to work. Bernanke is cut from the same cloth as other classical central bankers who assume that what’s good for the stock market is sooner or later good for the economy (a proposition which isn’t quite as true as it used to be). With the S&P 500 Index closer to an all-time high right now than a major low, why would he need to stimulate the economy? A sustained sell-off in the S&P, on the other hand, would be another story.
Looking back at every previous emergency bond buying scheme the Fed has done in the last 10 years, they’ve all occurred following a major plunge in the equity market. Why would the Fed break the mold now, especially in a sensitive election year?
I believe if we rationally answer these questions it will be seen that stimulus isn’t likely in the immediate horizon. But that doesn’t mean the Fed wouldn’t stoop to letting investors believe there will be stimulus. After all, in the investment world perception can take the place of reality for a while. A well placed word by a Fed governor here and there, a vague promise of being ready for action “if the need arises” has so far been sufficient to keep investors alive with hope. Whether that hope is manifest in higher equity prices or a higher gold price, sometimes hope is all that is really needed, short-term, to keep a bull market alive.
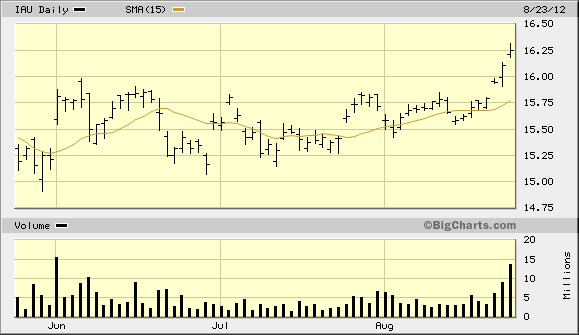
Now let’s have a look at gold’s latest breakout. Below is the 3-month daily chart for the iShares Gold Trust ETF (IAU), my favorite proxy for gold. It finally broke out of a nearly 3-month lateral range on Tuesday before following through even higher on Wednesday. I’ve been anticipating this breakout for the last couple of months, ever since the 10-month price oscillator for gold gave an extremely “oversold” reading, as discussed in previous commentaries. That signal finally paid put.

I think it’s also worth mentioning that according to a recent report of the World Gold Council (WCG), European purchase of bullion bars and coins rose 15%, revealing investors' demand for gold for capital preservation in light of the European debt and banking crises. The WGC also suggested that Russia will continue to be a driving force in the gold market. It is now the fourth largest consumer of gold jewelry and has the world's eighth largest gold reserves. There are enough economic crisis out there on the horizon to keep gold buoyant for some time to come even without the aid of a central bank stimulus.
Let’s enjoy this rally while it lasts, but let’s also remain disciplined in taking profits along the way, raising our stops to protect remaining profits.
2014: America’s Date With Destiny
Take a journey into the future with me as we discover what the future may unfold in the fateful period leading up to – and following – the 120-year cycle bottom in late 2014.
Picking up where I left off in my previous work, The Stock Market Cycles, I expand on the Kress cycle narrative and explain how the 120-year Mega cycle influences the market, the economy and other aspects of American life and culture. My latest book, 2014: America’s Date With Destiny, examines the most vital issues facing America and the global economy in the 2-3 years ahead.
The new book explains that the credit crisis of 2008 was merely the prelude in an intensifying global credit storm. If the basis for my prediction continue true to form – namely the long-term Kress cycles – the worst part of the crisis lies ahead in the years 2013-2014. The book is now available for sale at:
http://www.clifdroke.com/books/destiny.html
Order today to receive your autographed copy and a FREE 1-month trial subscription to the Gold & Silver Stock Report newsletter. Published twice each week, the newsletter uses the method described in this book for making profitable trades among the actively traded gold mining shares.
By Clif Droke
www.clifdroke.com
Clif Droke is the editor of the daily Gold & Silver Stock Report. Published daily since 2002, the report provides forecasts and analysis of the leading gold, silver, uranium and energy stocks from a short-term technical standpoint. He is also the author of numerous books, including 'How to Read Chart Patterns for Greater Profits.' For more information visit www.clifdroke.com
© 2005-2022 http://www.MarketOracle.co.uk - The Market Oracle is a FREE Daily Financial Markets Analysis & Forecasting online publication.


