


Adding Technical Indicators To Dividend Stock Selection Increases Total Returns
InvestorEducation / Learn to Trade Aug 22, 2012 - 07:52 AM GMTBy: Richard_Shaw

 We compared three approaches to dividend investing. In one scenario, we relied only on fundamental data and the consensus street analyst recommendation. In a second scenario, we required at least one bullish technical indicator. In a third scenario, we required at least two technical indicators to have some confirmation of the technical condition. The combination of fundamentals and two bullish indicators was a hands down winner for both total return over five years, and for avoidance of the 2008 market crash.
To perform the analysis, we used the Recognia backtesting tool. It is based on fundamentals, price performance, analyst opinions and certain technical patterns and indicators. The tool is available to customers of major brokers such as Schwab, Fidelity and TD Waterhouse, who meet certain account size or account activity minimums.
The Recognia Methodology:
In brief, Recognia does this: They use data from five years ago to select stocks that meet the filter criteria defined by the user. They then rank those stocks according to each filter criterion and average the ranks to create a final rank. They then hypothetically purchase the 10 highest ranked stocks (or as many as there are if less than 10), at the price at that time. They equal weight the stocks and hold them for 13-weeks (3-months). At the end of 13-weeks they repeat the selection process using the data that existed at that time, making additions and deletions to the prior list to end up with the top 10 stocks at that point in time. They repeat the process each 13-weeks (total of 20 selection events), and measure the total return of the process over various time periods, and plot the cumulative return over the entire 5 year period.
The Screen Criteria We Used For Each Of Screens A - C:
- Price minimum $10.00
- Market-cap minimum $500 million
- Dividend yield minimum 3% - maximum 15%
- Dividend coverage minimum 125%
- Dividend YOY growth rate minimum 0%
- Dividend 5-Yr growth rate minimum 0%
- Projected 5-Yr EPS growth rate minimum 5%
- Debt to total capital ratio minimum 0% - maximum 67%
- Current ratio minimum 0.8
- Street consensus rating minimum HOLD
The difference between Screen A-C are the minimum number of any bullish indicators that must also be present at the time of selection. Screen A requires zero bullish indicators. Screen B requires 1, and Screen C requires 2.
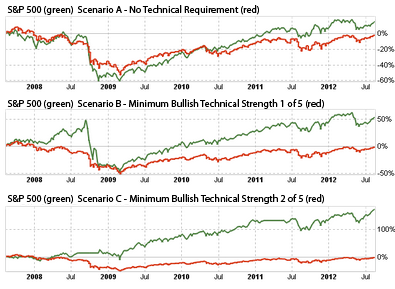
Cumulative Return Charts Comparison:
The most important difference between the three sets of screen criteria manifests in down markets. These three charts plot the 5-year total return of the backtested portfolios (shown in green) versus the S&P 500 (shown in red -- good investable proxies SPY, IVV or VFINX).
Screen A is on top and Screen C is on the bottom. Screen C (fundamental plus minimum 2 bullish technical indicators) is the superior choice. It generated more total return over 5 years, but perhaps more importantly it outperformed the S&P 500 during the 2008 crash.
Even though each screen includes a minimum average "street" recommendation of HOLD, that was insufficient to prevent the large losses in the 2008 crash. The requirement for a minimum of 2 bullish indicators was the salvation in 2008.
Avoiding losses is not only mathematically important, it is absolutely emotionally critical. For all that one might say or think, when faced with a plunging portfolio, most people will bail out (probably too late) and then wait too long to re-enter. The fact that Screen C prevents the kind of plunge that would cause an emotionally driven exit is perhaps its most valuable feature.
Using no bullish indicators actually produces a worse drop during the market crash, probably because yields become more attractive as stocks drop, and a ranking system that includes dividends without bullish indicators might encourage an investor to try catching a falling knife.
Using only 1 bullish indicator worked better than none on an overall basis, but did not prevent the full participation in the market crash, thereby exposing the investor to the badly timed tardy emotional exit and fear-driven tardy re-entry. By requiring at least 2 bullish indicators ("confirmation"), the investor was kept our of trouble.
Conclusion:
Price chart analysis should be used to cull the fundamentally selected list of prospective stock purchases.
It's true that we don't know which bullish indicators were present at each of the 20 portfolio reconstitution events over the 5 years, and this data does not suggest which bullish indicator worked best, or whether there is a single indicator that could suffice. However, it does fairly clearly establish that while fundamentals are necessary, they are not sufficient to achieve good results.
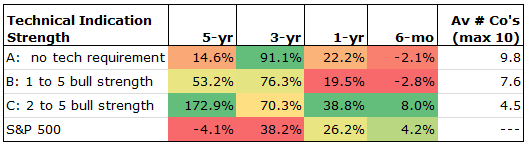
Tabular Total Return For the Three Screens versus the S&P 500:
In addition to the total return for various time periods, this table shows the average number of qualifying stocks that the method used over the 20 portfolio reconstitutions that took place at the end of each 13-week period. The maximum number of stocks used in a simulation was 10. If there were more than 10 qualifying stocks, then the top ten ranked stocks would be used.
Stocks Qualifying Under Screen C As of 2012-08-20:
This table shows all of the companies in the US and Canada that pass the combined fundamental screen with at least 2 bullish indicators as of 2012-08-20. Only the top 10 rated stocks would go into a portfolio begun today under the Recognia methodology tested in this experiment. There were 14 stocks that passed Screen C today, shown in the table below along with some of their attributes.
Note: The variable width green shading over each number highlights its rank versus the other data in the same column. To be able to consistently use wider green shading for better numbers, we inverted the debt-to-capital (to capital-to-debt) and inverted the consensus recommendation (from "1- best to 5- worst" to "5 -best to 1- worst").
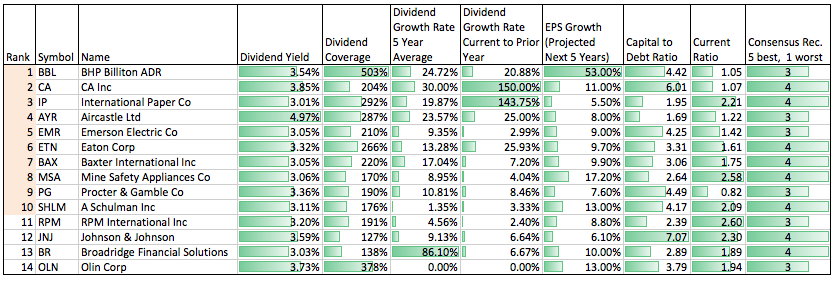
Links To Dynamic Bloomberg Data For the 14 Stocks:
BBL BHP Billiton ADR
CA CA Inc
IP International Paper Co
AYR Aircastle Ltd
EMR Emerson Electric Co
ETN Eaton Corp
BAX Baxter International Inc
MSA Mine Safety Appliances Co
PG Procter & Gamble Co
SHLM A Schulman Inc
RPM RPM International Inc
JNJ Johnson & Johnson
BR Broadridge Financial Solutions
OLN Olin Corp
Note: This list is not a set of QVM recommendations, although they are certainly worthy of further study. It is the list generated by the Recognia backtesting tool.
In a prior Seeking Alpha article, we used the Recognia tool to investigate whether high yields are “dangerous”, if bulllish technical indicators are also applied in the selection process.
By Richard Shaw
http://www.qvmgroup.com
Richard Shaw leads the QVM team as President of QVM Group. Richard has extensive investment industry experience including serving on the board of directors of two large investment management companies, including Aberdeen Asset Management (listed London Stock Exchange) and as a charter investor and director of Lending Tree ( download short professional profile ). He provides portfolio design and management services to individual and corporate clients. He also edits the QVM investment blog. His writings are generally republished by SeekingAlpha and Reuters and are linked to sites such as Kiplinger and Yahoo Finance and other sites. He is a 1970 graduate of Dartmouth College.
Copyright 2006-2011 by QVM Group LLC All rights reserved.
Disclaimer: The above is a matter of opinion and is not intended as investment advice. Information and analysis above are derived from sources and utilizing methods believed reliable, but we cannot accept responsibility for any trading losses you may incur as a result of this analysis. Do your own due diligence.
Richard Shaw Archive |
© 2005-2022 http://www.MarketOracle.co.uk - The Market Oracle is a FREE Daily Financial Markets Analysis & Forecasting online publication.