Gold Love Trade Cools as Central Banks’ Gold Demand Heats Up
Commodities / Gold and Silver 2012 Aug 21, 2012 - 06:00 AM GMTBy: Frank_Holmes
 The two largest gold buyers in the world that largely drive the Love Trade, China and India, underwhelmed the metals market with their subdued demand for the yellow metal during the second quarter of this year.
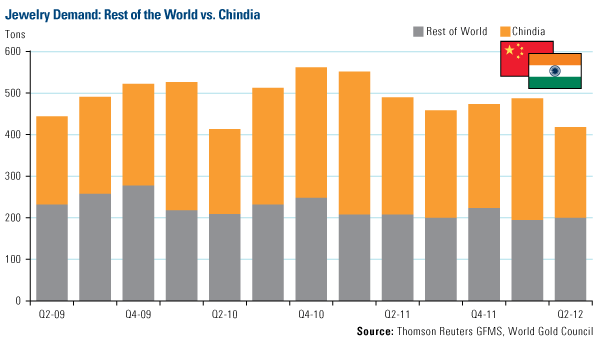
According to the World Gold Council’s (WGC) quarterly Gold Demand Trends report, total demand was 990 tons, which was about 7 percent lower compared to the second quarter of 2011. When you break down demand and look at the jewelry sector, you can see that Chindia remains about 50 percent of the world’s total gold demand. However, this quarter’s jewelry demand of a little more than 400 tons makes it one of the weakest periods in two years.
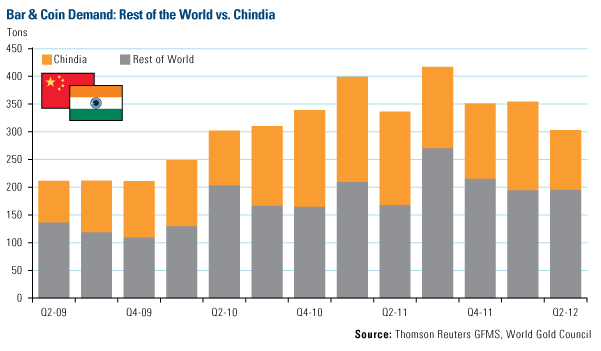
Total bar and coin demand was also weak in China and India compared with the rest of the world.
As we discussed earlier this year, India has been facing a number of economic challenges, resulting in a dramatic decrease of 30 percent in jewelry demand for the country over the second quarter compared to this time last year. The country’s “unsupportive environment” for gold included a slowing GDP growth, record high gold prices because of its currency, rising domestic inflation, high interest rates, and fears of a poor monsoon season, says the WGC.
China’s gold demand has been affected by a slowing economy as well as a “lack of clear direction in the gold price,” says the WGC. However, during the WGC’s conference call, Managing Director of Investment Marcus Grubb said it would be wrong to think that China is entering a period of extended weakness. If you look at Chinese demand for gold over the first half of 2012, the level was 410 tons—about the level that it was this time last year over the same period.
As we enter the Love Season for gold, we’ll look for any indications from government policies that might spur the continuation of the long-standing tradition of gold buying for weddings and Diwali in India, along with gold gifts for weddings and births that take place in China during this auspicious Year of the Dragon.
Although the Love Trade is on ice for the period, a relatively new gold buyer has been warming up to gold.
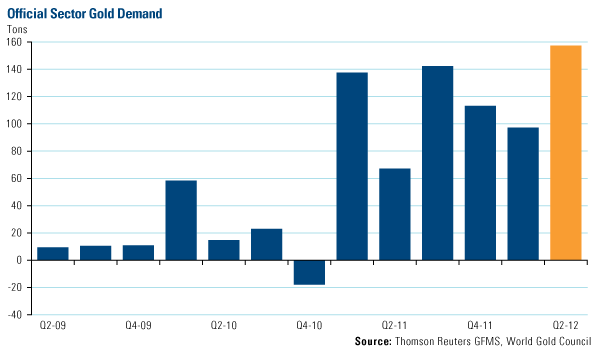
The official sector continued its gold buying spree this quarter. The WGC reported that central bank purchases hit a record high since the official sector became gold buyers three years ago. According to Mr. Grubb, if this trend continues over the remainder of 2012, central banks will be entering a “new territory” of gold buying that has not been seen since the early 1960s and since the end of the Bretton Woods System in 1971.
According to the firm’s quarter-end data, official sector institutions purchased 158 tons of gold in the second quarter—or about 16 percent of the quarter’s total gold demand. During the first half of 2012, central banks have acquired 254 tons of the metal, which is about 25 percent higher than the same period last year, says WGC.
Central banks from developing markets led the buying trend once again. The WGC says Kazakhstan indicated that it is “targeting an allocation to gold of 15 percent of its foreign exchange reserves” and one way it plans to build up its allocation is to purchase “the country’s entire domestic production over the next two to three years.”
Other emerging countries with central banks increasing their allocations to gold include Mexico, the Philippines, Russia, Turkey and Ukraine. According to Mr. Grubb, central banks have been motivated to add gold mainly as a currency hedge. Central banks want to increase their weightings in reserve asset portfolios and diversify away their dependence on U.S. dollars—and possibly the euro. There’s also a belief that sovereign debt is no longer considered to be a “risk-free” asset, says the WGC.
During his quarterly conference call, Mr. Grubb elaborated on this up-and-coming trend that we’ve been watching take place over the past 12 to 18 months. He believes gold is being “reintegrated into the fabric of the financial system” as a use of collateral. Mr. Grubb noted how “many exchanges are making gold eligible, with a haircut somewhere between sovereign debt and equities, as a collateral asset in all kinds of financial transactions.” The CME Group in the U.S. has already accepted gold as collateral, and just today, the European clearing house, the CME Clearing Europe, announced that gold bullion is now considered an “eligible collateral type.”
When it comes to collateral and capital requirements, “gold is being brought back into the fold as an important asset,” says Mr. Grubb.
Strike While Gold’s Not Hot?
There’s been a lot of discussion from market pundits wondering where gold is heading. I say investors should use math to their advantage. Similar to card counting strategies used by blackjack players, count historical trends to discover inflection points.
Gold appears to be at one of those inflection points right now. Using the last 10 years of data, if you plot the 12-month rolling return, you can see that gold has reached an extreme low, registering a -2 sigma.
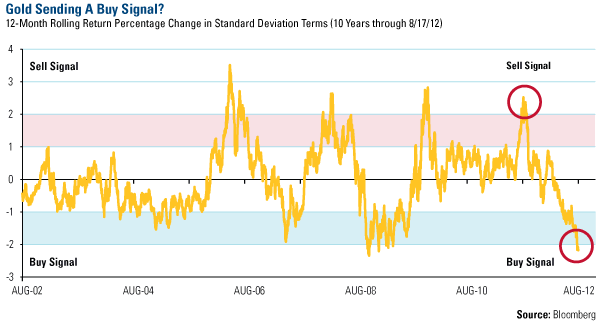
The last time gold reached this point was in August 2008. You can see below the yellow metal’s significant climb after hitting that standard deviation low.
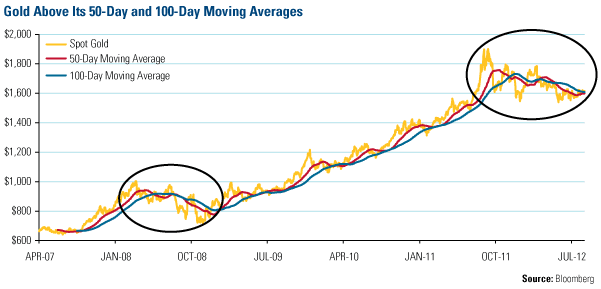
Just recently, the gold price has moved above its 50-day and 100-day moving averages, which is another indication of potential strength for the metal and an additional reason to believe that gold may be an attractive entry point.
I’ll be talking about gold and natural resources at the Chicago Hard Assets Investment Conference on September 21. If you’d like to learn more about attending the free event and when I’ll be speaking, send me a note at editor@usfunds.com.
For more updates on global investing from Frank and the rest of the U.S. Global Investors team, follow us on Twitter at www.twitter.com/USFunds or like us on Facebook at www.facebook.com/USFunds. You can also watch exclusive videos on what our research overseas has turned up on our YouTube channel at www.youtube.com/USFunds.
By Frank Holmes
CEO and Chief Investment Officer
U.S. Global Investors
U.S. Global Investors, Inc. is an investment management firm specializing in gold, natural resources, emerging markets and global infrastructure opportunities around the world. The company, headquartered in San Antonio, Texas, manages 13 no-load mutual funds in the U.S. Global Investors fund family, as well as funds for international clients.
All opinions expressed and data provided are subject to change without notice. Some of these opinions may not be appropriate to every investor.
Standard deviation is a measure of the dispersion of a set of data from its mean. The more spread apart the data, the higher the deviation. Standard deviation is also known as historical volatility. All opinions expressed and data provided are subject to change without notice. Some of these opinions may not be appropriate to every investor. The S&P 500 Stock Index is a widely recognized capitalization-weighted index of 500 common stock prices in U.S. companies. The NYSE Arca Gold BUGS (Basket of Unhedged Gold Stocks) Index (HUI) is a modified equal dollar weighted index of companies involved in gold mining. The HUI Index was designed to provide significant exposure to near term movements in gold prices by including companies that do not hedge their gold production beyond 1.5 years. The MSCI Emerging Markets Index is a free float-adjusted market capitalization index that is designed to measure equity market performance in the global emerging markets. The U.S. Trade Weighted Dollar Index provides a general indication of the international value of the U.S. dollar.
Frank Holmes Archive |
© 2005-2022 http://www.MarketOracle.co.uk - The Market Oracle is a FREE Daily Financial Markets Analysis & Forecasting online publication.


