Copper Prices Signaling Stock Market Top
Stock-Markets / Stocks Bear Market Aug 21, 2012 - 03:52 AM GMTBy: Chris_Vermeulen
 The past 5 – 6 weeks have seen equity prices move considerably higher amid growing concerns regarding the European debt crisis, the instability of the Middle East, and ultimately the potential for a major economic slowdown in the United States.
U.S. equity indexes have continued to climb the proverbial “Wall of Worry” since the first week of June and have put on an incredible run. This past Friday saw the S&P 500 Index (SPX) post the highest weekly close of 2012. The perma-bears have been calling for a top and continue to run scared as light volume and volatility have given the bulls an edge during August.
The next key overhead resistance level for the S&P 500 Index to hurdle is the 1,440 resistance zone lingering slightly overhead. I try to refrain from calling tops or bottoms as I feel its a fool’s game that ultimately humbles most market prognosticators. If calling tops and bottoms was easy, investors and traders alike would be able to produce monster gains all the time with uncanny precision.
Instead of trying to predict where the S&P 500 Index will find resistance or create an intermediate to longer-term top, I will simply posit some technical and macro-economic data that indicates we are likely closing in on a major top.
As stated above, the recent rally we have seen has taken place on relatively light volume and plunging volatility as measured by the Volatility Index (VIX).
Volatility Index (VIX) Weekly Chart
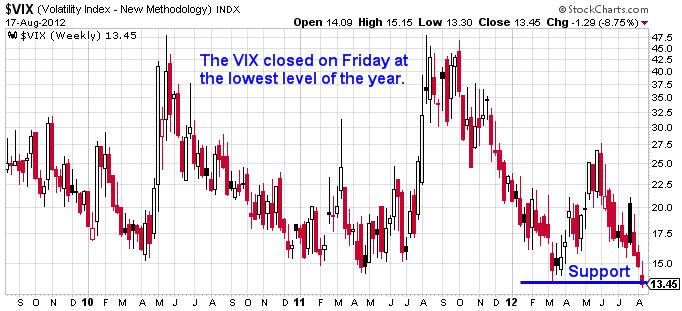
As can be seen above, Friday’s weekly close for the VIX was the lowest in 2012 and ultimately one of the lowest closing price levels in several years. While the VIX is trading at a major intermediate low, there remains a lower support level going back to late 2006 and the early part of 2007 around the 10 price level.
The perma-bulls would argue that we could see those 2006 – 2007 lows tested, but based on September monthly VIX options the option market seemingly is arguing that we are approaching an intermediate low in the Volatility Index. The chart below illustrates the September VIX option chain based on Friday’s closing prices.
Volatility Index (VIX) September Monthly Option Chain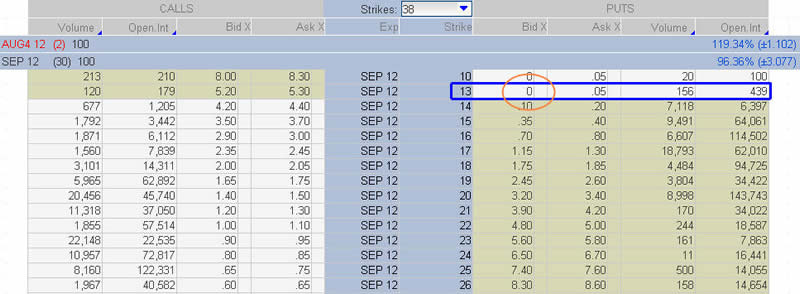
Price action is never wrong, but many times a great deal of information can be acquired by simply reviewing option prices. As can be seen above, the VIX closed on Friday at 13.45, a new 2012 low. However, when we consider the prices in the VIX September option chain shown above I would point out that the VIX September 13 Puts are 0 bid.
What this essentially means is that the VIX options market is saying that the Volatility Index is unlikely to move below 13 in September. For readers unfamiliar with options, selling a naked put or using a put credit spread are two trading structures that are bullish regarding the underlying asset which in this case is the VIX.
The VIX September 13 puts are offered at 0.05 on the ask, but are at 0 on the bid. This means that the VIX market makers are not expecting to see the VIX move below 13. Clearly this is not a guarantee as there is never a sure thing in financial markets. However, this pricing situation for the September 13 VIX Puts is favorable for the equity bears in September.
In layman’s terms, the VIX needs to move higher in the next 3 weeks based on the fact that the September VIX 13 Puts are 0 bid. This is one of several clues that we could be nearing a major top in the S&P 500 Index in the very near future.
When we look at a weekly chart of the S&P 500 Index (SPX) it is obvious that we have a major longer term breakout which occurred this past week. However, there remains additional resistance overhead in the 1,440 – 1,450 price range.
S&P 500 Index (SPX) Weekly Chart
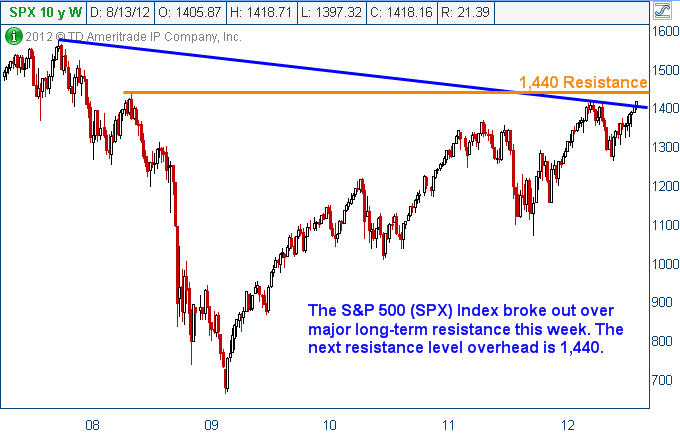
While 1,440 might be a major area where a significant top could form, a rally above this level cannot be ruled out entirely. However, the chart above gives traders and investors a context for where possible tops could form.
A reversal could play out almost immediately at the current levels or we could move considerably higher before finding major resistance that holds. For now, we do not have enough evidence based on the S&P 500 Index price chart to proclaim that a top has formed or will form in the near future.
Another underlying asset that I monitor closely is copper futures. Generally speaking, if copper futures are rallying economic conditions tend to be strong. The opposite can be said when copper futures are under selling pressure. Recently copper futures prices have been trading in a relatively tight trading range, but the longer-term weekly chart shown below demonstrates that should prices start to selloff, a major selloff could transpire.
Copper Futures Weekly Chart
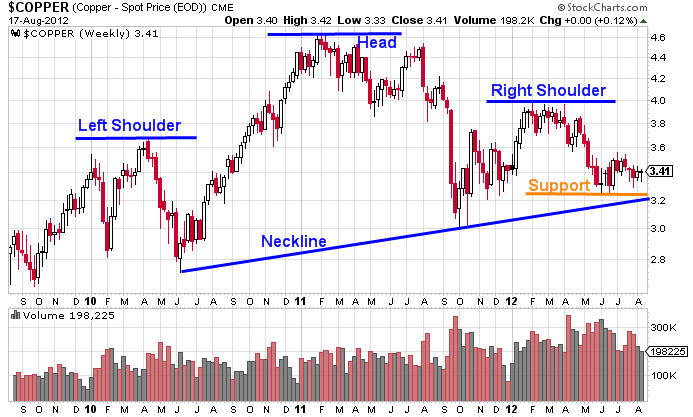
As shown above, there is a monstrously large head and shoulders pattern (bearish) that goes back to early 2010 that has formed on the weekly chart. Should the neckline of this pattern get taken out on a weekly close the selling pressure that could transpire could be devastating regarding the price of copper.
However, a major selloff in copper would also indicate that economic conditions were weakening globally. If copper triggers this bearish pattern, it would likely not be long before other risk assets followed suit.
In addition to the possibility that major selling pressure could await copper should that pattern trigger, another macroeconomic data point would argue that economic conditions are already starting to contract. The chart shown below, courtesy of Bloomberg, illustrates the amount of waste hauled by railroad cars and the implicit correlation to U.S. gross domestic product (GDP).
Waste Railcar Loads Versus GDP Chart
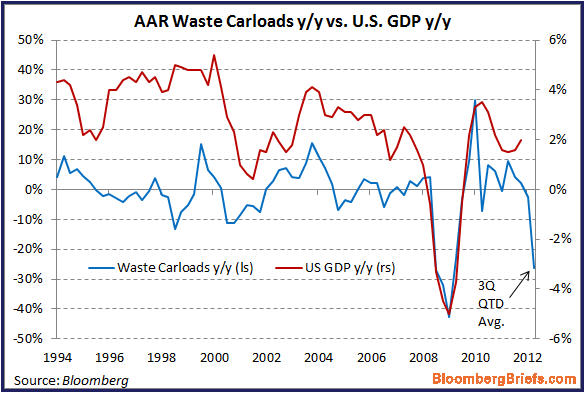
Recently Zerohedge.com posited an article that featured this chart and a link to that article is found HERE. The article and the accompanying chart demonstrate that as more products are produced, additional waste can be expected. As shown above, the amount of waste being produced and hauled by railcar has fallen off a cliff and should longer-term correlations remain intact a contraction in U.S. GDP is likely not far away.
There are a multitude of other topping triggers that I follow that are all screaming that a major intermediate and possibly even a longer-term top is nearby. However, at the moment the price action in the S&P 500 Index (SPX) is arguing otherwise.
Picking tops and bottoms in advance is extremely difficult and generally foolhardy, however when multiple triggers are going off regarding a possible type I pay close attention to price action. While I will not go as far as to say where specifically a top in the S&P 500 Index will form, I believe that a top is forthcoming and could even occur in the next 2 – 3 weeks.
Price is never wrong, and eventually I suspect that price will tell us what we wish to know. For now, I am going into the next few weeks with caution regarding the upside in risk assets. However, it is important to point out that I am not looking to get short risk assets either.
My research indicates that a major inflection point is coming and it could coincide with the Federal Reserve’s Jackson Hole summit. It could coincide with an event that we are unaware of as well. At the moment risk in either direction seems high and caution regardless of directional bias should be exercised. The next few weeks should tell the ultimate tale.
By Chris Vermeulen and J W Jones
If you would like to receive my free weekly analysis like this, be sure to opt-in to my list: http://www.thegoldandoilguy.com/free-preview.php
By Chris Vermeulen
Chris@TheGoldAndOilGuy.com
Please visit my website for more information. http://www.TheGoldAndOilGuy.com
 If you are looking for a simple one trade per week trading style then be sure to join www.OptionsTradingSignals.com today with our 14 Day Trial.
J.W. Jones is an independent options trader using multiple forms of analysis to guide his option trading strategies. Jones has an extensive background in portfolio analysis and analytics as well as risk analysis. J.W. strives to reach traders that are missing opportunities trading options and commits to writing content which is not only educational, but entertaining as well. Regular readers will develop the knowledge and skills to trade options competently over time. Jones focuses on writing spreads in situations where risk is clearly defined and high potential returns can be realized.
This article is intended solely for information purposes. The opinions are those of the author only. Please conduct further research and consult your financial advisor before making any investment/trading decision. No responsibility can be accepted for losses that may result as a consequence of trading on the basis of this analysis.
© 2005-2022 http://www.MarketOracle.co.uk - The Market Oracle is a FREE Daily Financial Markets Analysis & Forecasting online publication.


