


Stock Market Running On Empty!
Stock-Markets / Financial Markets 2012 Aug 14, 2012 - 03:31 AM GMTBy: UnpuncturedCycle

 The budget should be balanced, the Treasury should be refilled, public debt should be reduced, the arrogance of officialdom should be tempered and controlled, and the assistance to foreign lands should be curtailed lest Rome become bankrupt. People must again learn to work, instead of living on public assistance. –Marcus Tullius Cicero (106-43 BC); Roman Statesman
It becomes harder and harder to find the truth and that certainly holds true with respect to government statistics. The investment world was pleased with the recent jobs report claiming 163,000 posts were created in July. It was a small step, but at least it was in the right direction. Or was it? When I tell you that the numbers are fudged I realize that doesn’t carry a lot of weight, but here’s what the Washington Post had to say about how the Bureau of Labor Statistics processes data:
The U.S. economy lost 1.2 million jobs between June and July. But that’s not how it got reported. When the Bureau of Labor Statistics (BLS) released its jobs figures for July, it said the economy gained 163,000 jobs. So what gives?
BLS isn’t hiding anything. The discrepancy just has to do with what’s known as “seasonal adjustments.” The U.S. economy follows certain predictable patterns in hiring and layoffs every year. School districts always let workers go for the summer and hire in the fall. Retailers always staff up for the Christmas holidays and lay people off afterwards. Students always flood the labor market in June.
So if we want to know how well the economy is doing, we want to know how many jobs were added after taking these predictable fluctuations into account. Some seasonal adjustments are necessary before the data can tell us anything useful.
And this is exactly what BLS does in its monthly jobs reports. As Jacob Goldstein of Planet Money points out, the U.S. economy had 1.2 million fewer jobs in July than it did in June. But, according to the bureau, the economy still had 163,000 more jobs than one would’ve expected, given seasonal trends. That’s a sign of a steadily recovering labor market. So BLS reported it as a 163,000 gain in jobs.
So we can see that two plus two equals five, and that is especially true during an election year.
With respect to the US economy we saw that the prices paid for U.S. imports fell 0.6% in July, the Commerce Department said Friday. That compared to a revised 2.4% drop in June. The decline in June was originally reported as 2.7%, mainly because of falling oil prices. Oil prices also fell in July, but at a much slower rate. Economists surveyed by MarketWatch had expected import prices to be unchanged in July. Excluding fuel, import prices dipped 0.4% last month. The price of U.S.-made goods exported to other nations, meanwhile, rose 0.5% in July after a 1.7% decline in the prior month.
This decline in the price of exports to the US ties in to my theory that America is in fact importing deflation. China and Asia are desperately trying to devalue their currencies in an effort to have the most competitive prices due to sharp declines in consumption
around the world. That’s why we see a continual decline in the Baltic Dry Index with a clear pattern of lower highs and lower lows. Earlier this week it gapped down and broke a trend line that’s offered support all year.
No one is more aware of the reality than China. On Friday we learned that the Chinese economy was experiencing anemic growth in its monthly industrial output and retail sales figures — heightened worries about the nation’s economic outlook have dragged down equities, commodities and “risk currencies” such as the Australian dollar. The trade surplus for the month dropped to $25.1 billion from $31.7 billion in June, falling far short of estimates for a surplus of $35.2 billion in a Dow Jones Newswires survey of economists. Exports rose just 1% from the year-ago period, while imports expanded 4.7%, compared to expectations for an 8% rise in exports and a 7% rise in imports. In June, China’s exports rose 11.3%, while imports increased 6.3%. “Trade data has come in dramatically below expectations — the worst export growth number (excluding Chinese New Year) since November 2009 — highlighting the risk that the external environment poses to an economy,” wrote IHS Global Insight economists Alistair Thornton and Xianfang Ren. “This confirms that the strong export numbers in May and June were, as expected, complete anomalies,” they said.
So the world’s economic engine has stalled, countries are collectively trying to devalue their respective currencies as they fight for table scraps in the export markets, and consumption is falling in both Europe and the US. If you want further proof of a slow down all you have to do is take a look at “Dr. Copper.” Copper is found in a large percentage of the goods we use on a daily basis, and the direction of its price is often an indicator of the direction of the economy:
As you can see copper prices appear to be rolling over having moved sideways with a downward tilt through numerous long-term trend lines. This type of process creates a series of what’s called “fan lines” and it is an indicator that problems may be close at hand. Also, you can see that both RSI and MACD have turned down and the histogram is negative.
As we see one economy after another succumb to deflationary stress, investors have sought shelter in the greenback and the re-
sult has been a bear market rally that has lasted more than a year. It caught almost everyone off guard since the whole world was short the US dollar a year ago.
The question now becomes how much of any future problems are
Source: http://www.321gold.com/editorials/sfs/hubbartt081012.html
already priced into the dollar and where will it go from here? For the answer to these questions I’ve posted a chart by Morris Hubbartt that reflects my views. The dollar broke out above what was strong resistance at 81.45 (now strong support) back in May and made it as high as 84.10 in late July. The dollar has since retreated somewhat but should bounce when it gets down to 81.45. A subsequent reaction should then complete the current head-and shoulders pattern and we should see a break of 81.45 sometime in mid-September. Finally, notice in this particular daily chart the existence of not one but three head-and-shoulders formations. Yet all of these are included in a much big-
ger head-and-shoulders formation that stretches all the way back to 2008. This bigger formation should be completed be the end of the year. In short I am saying that the dollar has now more than likely topped and will soon turn lower.
Another market that just may be running out of gas is the bond market. As you can see in this historical chart, it’s been in a bull market for almost three decades:
I have highlighted what I believe could be the final blow-off phase of a bull market that began in the late 80’s. The flip side of falling
bond prices is a rising interest rate and you can see that rates have moved higher over the last couple of weeks. In fact we’ve experienced not one but three gaps to the upside, and two of those remain unfilled. Of course we’ve seen this before and then bonds move higher, but now there is the question of risk. We have the approaching “fiscal cliff” and sooner or later the Fed will unleash QE3. That raises the risk and that in turn will force rates higher. If bonds haven’t topped, they are close.
The third prong on our trident is the stock market. Many folks are bullish stocks claiming that they are cheap, but I couldn’t disagree more. The Price/Earnings Ratio for the S & P is 23 while the average dividend yield is 1.95% and the latter is historically very low as you can see here:
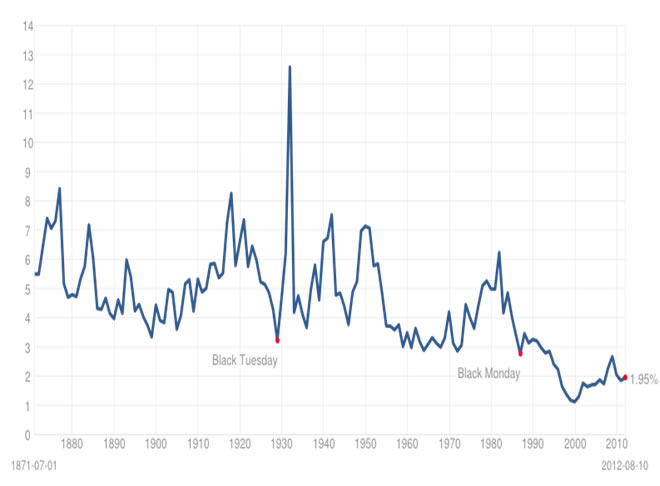
In fact it is well below the worst levels prior to the Great Depression. Both the current PER and dividend yield are indicative of bull market tops and are nowhere near the numbers you would see if the market were “cheap”. In a truly cheap market the PER would be around 6 or 7 and the dividend yield would be above 6%. Right now those levels are just a nice dream!
Currently the Dow has been carving out a series of higher highs as
it tries to break out above the May 1st closing high of 13,279. The market fell to a June 4th closing low of 12,101 (22 days down) and has required 49 days and it still can’t make a new bear market top. We’re 71 days off of the low and this week’s volume is the lightest in five years, so it is very difficult to paint a bullish picture.
Then we have the Transportation Index that is doing the opposite
as it diverges from the Dow and forms a series of lower highs. This week was a perfect example as the Dow rallied four out of five sessions while the Transports declined three out of five sessions. For those of you that follow Dow Theory (and I do!), this is a “warning.”
So in spite of the Dow moving higher it has failed to close above its May 1st closing high, and even if it did it wouldn’t be confirmed by the Transports. Also, as I mentioned previously we have the absolutely terrible volume this week; the lowest weekly total in more than five years. Then we have Lowry's Selling Pressure Index (supply) is now 201 points above their Buying Power Index (demand). With Selling Pressure so dominant, any cessation of buying will send the market lower. As a result I am looking for the Dow to make one last gasp higher high, unconfirmed by the Transports, and then turn lower. The decline will catch everyone
off guard due to the extremely high level of complacency that exists among investors. This week the Volatility Index (VIX) broke and closed well below what was strong support at 15.55; proof that absolutely no one is worried. That’s a big mistake!
Many months ago I told clients that when the market begins to unwind, we’d see the dollar, the bond and the stock market moving down in tandem, and now we're almost there. That only leaves one port in the storm and that port is gold:
There may or may not be a flight into tangible assets (commodities, gems, real estate, and art) but there will most definitely be a flight into gold and all the manipulation in the world will not be able to stop it. Gold’s Point & Figure chart has finally turned up with a bullish price target of 1,780.00:
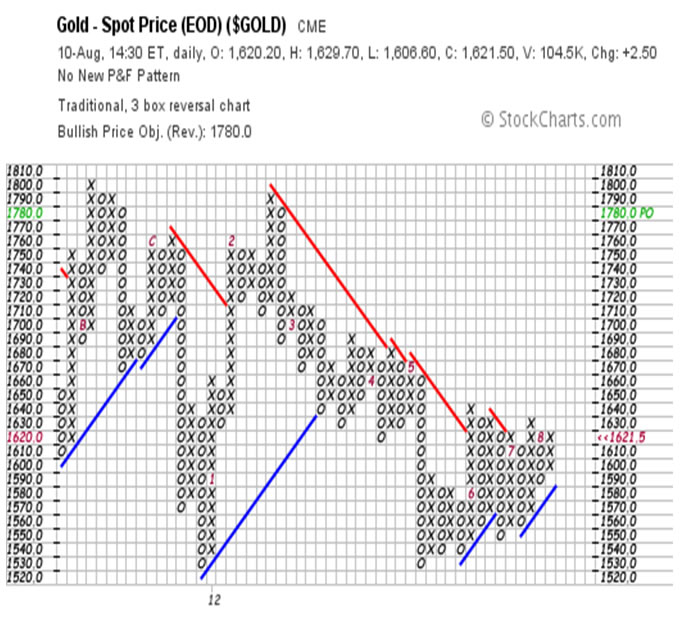
and it has clearly broken out to the upside as you can see in gold’s daily chart.
Gold closed out the week at 1,621.50, a 15.00 gain for the week and after testing the support from the 50-dma on Monday. Right now gold has strong support at 1,596.90 while good resistance is up at 1,635.10, but the real key is what happens when gold tests strong resistance at 1,671.60. Perhaps more importantly gold is not going it alone; silver also broke out two weeks ago and is resisting attempts to push it lower:
After numerous attempts to break down through strong support at 26.45, silver finally was able to rally and move up through good resistance at 27.65. The spot silver price closed out the week at 28.05 and really doesn’t have much in the way of resistance until it hits the June intraday high of 29.86. The next level of strong Fibonacci resistance is up at 31.91 and that is still a long way away. Finally, silver has an extremely positive Point & Figure chart
with a bullish price target of 58.00! That of course would be a new all-time high and it would finally confirm gold’s all-time high from last September.
The yellow metal is also receiving support from the gold stocks as they move higher. As you can see in the daily chart below, the HUI broke out to the upside for a second time in less than two weeks on Friday:
It is also back above the 50-dma and that moving average has turned up, as have the RSI, MACD and histogram. The HUI has now put in a higher low but the real test will come when the Index tests strong resistance at 455.00 and tries to post a higher high. Although I haven’t posted it here, the Point & Figure chart for the HUI has a bullish price target of 476.00 and that’s the first time in almost a year that all three (gold, silver and the HUI) have enjoyed bullish price targets at the same time.
CONCLUSION
In an atmosphere where the world’s central banks are dedicated to stealing the wealth of the masses in order to order to protect the immense wealth of a select few, you have very little recourse. This is especially true since they control the press, the politicians and the legal system. If you expect the government to go after MF Global you can forget it. The owner is wealthy, he’s an ex-Governor and Senator, and his attorney used to be Eric Holder the now US Attorney General. If you hire a lawyer and go after then, they have twenty of them and you’ll end up paying for your lawyer’s child to go to the University while your child has to resort to student loans.
As bad as things are now, they are about to get a lot worse. Both the ECB and the Fed are trying to talk the stock markets higher while suppressing the price of gold. Their success has been average at best as the Dow has yet to surpass the May 1st high and gold is now US $100.00 above it’s mid-May low. I might add that gold has done this even though stocks, the dollar and the bond were all moving higher. Sooner or later the Fed and ECB will stop talking and act. In my opinion you will not see a massive QE3 that a lot of investors are looking for. Instead you’ll see monthly QE’s as they try to fly under the radar so as not to attract attention and criticism. Regardless of the method, monthly or massive, it’s still the wrong policy and the wrong way to go. Once QE starts gold will not only go up through 2,000.00, it will go up through 3,000.00!
Your only recourse in a world gone mad is to buy gold and silver and keep a very low profile. Stay off the Internet, stay off of Facebook, buy gold and silver (physical if possible), and try to eliminate all debt. Pay for things with cash and avoid the use of credit/debit cards. Keep enough cash in your house to survive for 60 days in case of an emergency, and keep silver coins just in case the cash becomes worthless. A good supply of food and water will be needed too. Try and get a second passport and open an account overseas. There are lots of good places besides Switzerland; Singapore, Hong Kong, Uruguay, Dubai and New Zealand come to mind.
The key to everything is to preserve your wealth and the only way to do that is to buy gold and silver. The government will try to take it from you so you’ll have to lie and say you don’t have any. That’s why it’s important you don’t tell anyone about it. If your best friend gets hungry enough, he’ll sell you out for the reward. Traveling will become difficult as you’ll need an exit visa to leave the US and may even need some sort of permit to move from state to state. The excuse will be that America is under attack from foreign terrorist and you need to trade your freedom for “security”. Oh, you’ll be at war too and more than likely it will be with Iran and a few other Middle Eastern countries, and possibly even China!
We are most certainly headed for interesting times. Like the VIX showing complacency in the market, there is a significant level of complacency in every facet of American society. Fortunately there is also some unrest brewing but I assure you the government will do everything possible to stop it. You’ll have to choose sides, and it will not be an easy choice. The end result will more than likely be a bankrupt economy, like what happened in Russia, and what comes after that is anybody’s guess. The good thing about gold is that it’s easily portable and known around the world. Do yourself a favor and buy some while it’s still cheap because you are going to need it!
www.unpuncturedcycle.com
theunpuncturedcycle@gmail.com
Copyright © 2012 Giuseppe L. Borrelli
- All Rights Reserved Disclaimer: The above is a matter of opinion provided for general information purposes only and is not intended as investment advice. Information and analysis above are derived from sources and utilising methods believed to be reliable, but we cannot accept responsibility for any losses you may incur as a result of this analysis. Individuals should consult with their personal financial advisors.
© 2005-2022 http://www.MarketOracle.co.uk - The Market Oracle is a FREE Daily Financial Markets Analysis & Forecasting online publication.