


World Fresh Water Maps
Commodities / Water Sector Aug 12, 2012 - 07:37 AM GMTBy: Richard_Shaw

 Fresh water is a fixed quantity. Population and water usage per capita are rising quantities. When the demand exceeds supply, various forces come into play: allocation by price and affordability, efficiency changes, investment in desalination, legal disputes and at some point wars.
Total world consumption of fresh water currently exceeds the replenished amount. The difference is being made up by (1) draining fresh water lakes, and (2) drilling into geologically trapped water that is not replenished. Once those are fully tapped, people hit the wall, and something altogether new has to be done with and about water in their area.
What also is in effect now and will increase over time is the exportation of water, not by shipping water itself, but by growing food in water rich countries and exporting the food (and by indirection the water) to water poor countries.
This is one reason that we like the idea of investing in palm oil plantations, which exist in tropical areas with high rainfall and abundant water. We like Brazilian farms too, where soybeans and other foods are grown in quantity. The problem there is that public farming companies with Brazil operations, tend to have substantial Argentinian assets, and anyone who own strategic assets (such as oil or land) in Argentina is a sitting duck for nationalization).
Parts of South America and Southeast Asia are particularly blessed with water resources. The oil rich Middle East is below the water poverty line. Currently oil producing Middle East countries are effectively trading oil for water.
There are about 43,600 cubic kilometers of obtainable rain replenished freshwater on earth per year, but that is less than 1/2 of total rainfall. The balance evaporates or is otherwise unavailable, and once it makes it to the sea, it is no longer fresh.
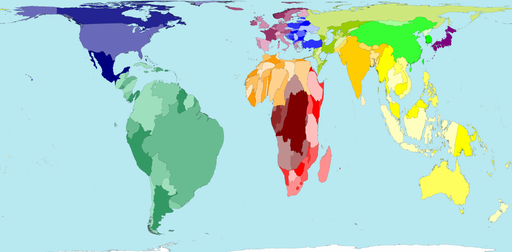
Map of the World With Countries Sized by Rainfall Amount:
(source: WorldMapper.org)
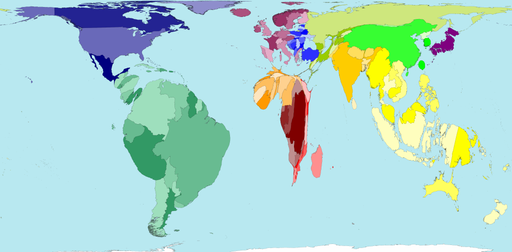
Map of Countries By Total Fresh Water Resources:
(source: WorldMapper.org)
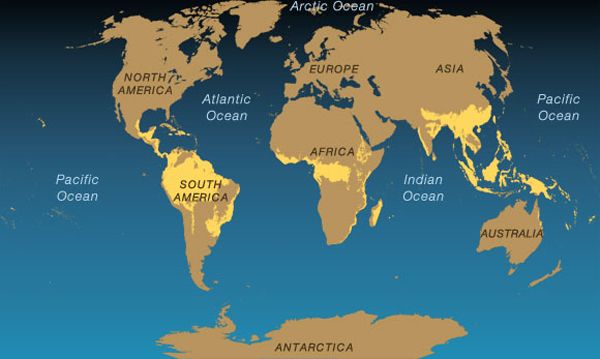
Map Showing Location of Tropical Forests Around the World
(source: National Geographic)
By Richard Shaw
http://www.qvmgroup.com
Richard Shaw leads the QVM team as President of QVM Group. Richard has extensive investment industry experience including serving on the board of directors of two large investment management companies, including Aberdeen Asset Management (listed London Stock Exchange) and as a charter investor and director of Lending Tree ( download short professional profile ). He provides portfolio design and management services to individual and corporate clients. He also edits the QVM investment blog. His writings are generally republished by SeekingAlpha and Reuters and are linked to sites such as Kiplinger and Yahoo Finance and other sites. He is a 1970 graduate of Dartmouth College.
Copyright 2006-2011 by QVM Group LLC All rights reserved.
Disclaimer: The above is a matter of opinion and is not intended as investment advice. Information and analysis above are derived from sources and utilizing methods believed reliable, but we cannot accept responsibility for any trading losses you may incur as a result of this analysis. Do your own due diligence.
Richard Shaw Archive |
© 2005-2022 http://www.MarketOracle.co.uk - The Market Oracle is a FREE Daily Financial Markets Analysis & Forecasting online publication.