Three Charts Every Gold Stock Trader Should See
Commodities / Gold and Silver 2012 Aug 10, 2012 - 06:43 AM GMTBy: DailyWealth
 Jeff Clark writes: Everything is falling in place for a big gold stock rally...
So far this year, it's been tough to make money owning gold stocks. Every rally has been weak. Every subsequent decline has been steep. The big gold stock fund, GDX, for example is down 25% over the last 12 months.
This decline has made gold stocks very cheap... and ready to rally. Let me show you what I mean...
We'll start with one of my favorite sector indicators.
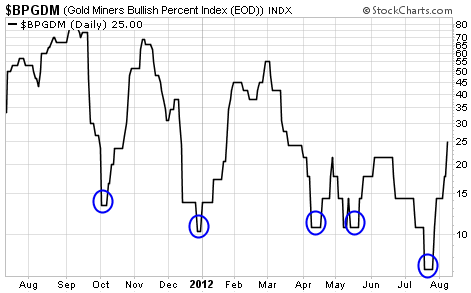
The precious metals sector bullish percent index (BPGDM) generates a buy signal when it drops into oversold territory (below 30) and turns higher. Late last month, it generated a buy signal, and it has continued higher since then. Take a look...

The blue circles indicate the buy signals we've seen over the past year. The signals that triggered in 2011 generated large gains for the gold sector (and for my S&A Short Report readers).
We haven't had the same experience in 2012. The buy signals this April and May never reached their potential. We settled for much smaller profits than I had originally anticipated. But this time, I suspect the buy signal will be stronger and carry the sector much higher.
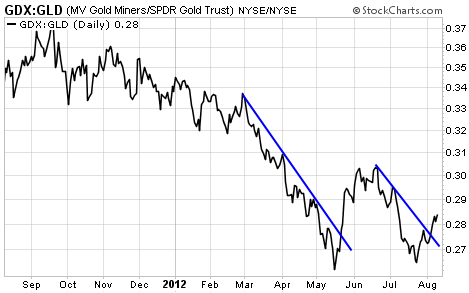
And we have two more indicators that argue for higher gold stock prices. First, there's the following chart, which compares the action in gold stocks to the action in gold...
For most of the past year, gold stocks have lagged the action in gold. So this ratio chart has been falling. For a few weeks in May, though, gold stocks outperformed the metal. They've been outperforming for the past two weeks as well.

The best time to own gold stocks for the intermediate term (several months) is when the stocks are outperforming the metal. In other words, you want to own gold stocks when this chart is rising. That's the case today.
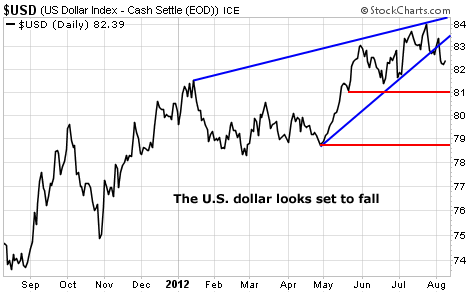
Finally, we also have this bearish development in the U.S. dollar index...
The U.S. dollar just broke down from a bearish rising-wedge pattern (the blue lines). At a minimum, the greenback should fall toward the first red support line at about 81. But there's a pretty good chance the dollar will give up the gains it's made since March and drop all the way back down to just below 79.

A falling dollar is typically bullish for gold. And a rising gold price is typically a good thing for gold mining stocks.
Nothing is guaranteed. But these charts are bullish for gold stocks... and we now have a low-risk, high-reward trading opportunity in front of us.
Best regards and good trading,
Jeff Clark
P.S. Even though the gold sector is set to rally, it won't be a straight-up "rocket shot." Gold rallies are notoriously volatile, with large swings in both directions. So it's important to properly time the purchases. That's what I specialize in with the S&A Short Report. You can learn more about my trading system – and my strategy with the precious metals sector – here.
The DailyWealth Investment Philosophy: In a nutshell, my investment philosophy is this: Buy things of extraordinary value at a time when nobody else wants them. Then sell when people are willing to pay any price. You see, at DailyWealth, we believe most investors take way too much risk. Our mission is to show you how to avoid risky investments, and how to avoid what the average investor is doing. I believe that you can make a lot of money – and do it safely – by simply doing the opposite of what is most popular.
Customer Service: 1-888-261-2693 – Copyright 2011 Stansberry & Associates Investment Research. All Rights Reserved. Protected by copyright laws of the United States and international treaties. This e-letter may only be used pursuant to the subscription agreement and any reproduction, copying, or redistribution (electronic or otherwise, including on the world wide web), in whole or in part, is strictly prohibited without the express written permission of Stansberry & Associates Investment Research, LLC. 1217 Saint Paul Street, Baltimore MD 21202
Disclaimer: The above is a matter of opinion provided for general information purposes only and is not intended as investment advice. Information and analysis above are derived from sources and utilising methods believed to be reliable, but we cannot accept responsibility for any losses you may incur as a result of this analysis. Individuals should consult with their personal financial advisors.
Daily Wealth Archive
|
© 2005-2022 http://www.MarketOracle.co.uk - The Market Oracle is a FREE Daily Financial Markets Analysis & Forecasting online publication.


