Gold Short-term Weakness, Long-term Bullish
Commodities / Gold & Silver Feb 03, 2008 - 06:06 PM GMTBy: Merv_Burak
 A generally okay week BUT with a weak momentum and a collapse on Friday. Let's see if it is of any REAL significance.
GOLD : LONG TERM
The long term P&F chart made a new high X during the week and continues in a bullish trend. There is yet no hint of trouble from the P&F chart but it would not show it for some time. We go to the normal indicators to see if there is any hint of a problem.
From a long term perspective, gold is well above its moving average line and the line continues to point upward. This is the main indicator of trend that I generally look at, there are others but this is the main and simplest indicator. So, the trend is still positive but what about the strength of that trend. Here I go to the momentum indicator. My preference is the 150 day RSI (or 30 week RSI if I am looking at a weekly chart). The momentum indicator is still very positive and confirming the recent price move into new highs. However, the past few days of activity has shown up as weakness in the momentum and the actual trend has now turned downwards with the momentum indicator crossing its long term trigger line.
The trigger line is also following the indicator by turning towards the down side but as of Friday has only turned into a horizontal direction. Another day or two of downside action would be required to turn the trigger line towards the down direction. I place greater emphasis on the trigger line slope than the fact that the indicator has crossed the trigger line. I eliminate many whip-saw situations that way. The volume indicator is still above its positive sloping trigger line but the indicator has not been able to exceed the level it reached in early November while the price of gold is well above its November level. This can be seen as a volume negative divergence.
To summarize all that confusion, the price of gold bullion can still be rated as BULLISH from the long term perspective but we are getting the first hints of weakness and that needs to be watched. Of course if there should be a turn around in the trend it would be signaled first in the intermediate and short term indicators.
INTERMEDIATE TERM
If one were to go back to the intermediate term P&F chart shown last week, where we are today would be right on top of the upper (red) resistance line that has kept the price of gold below since the start of this latest move in Oct of 2006. The expectation would be for a reaction back to the lower up trend secondary support line represented by the dashed blue line. That would keep the price above its previous low and remain in a positive intermediate term trend. However, it is expected that should a reaction take hold it would most likely not be a straight down move but would fluctuate to some degree. So any projection of support, resistance, bottoms or tops is fraught with changes as time goes by. For now the intermediate term P&F continues to shout BULL.
As for the normal indicators, they are shouting the same, at least for now. Gold is above its positive sloping moving average line, momentum is in its positive zone and the volume indicator is above its trigger line. However, as with the long term there are a few warning bells ringing here. The momentum indicator has given us a negative divergence versus gold by not exceeding its November high. It has also dropped below its trigger line and on Friday the trigger line turned downward. So, although still in its positive zone the direction of momentum is downwards.
To summarize, the gold rating for the intermediate term is still BULLISH but we now have the first confirmed warnings of a possible change in direction for gold (as opposed to an actual trend change.
SHORT TERM

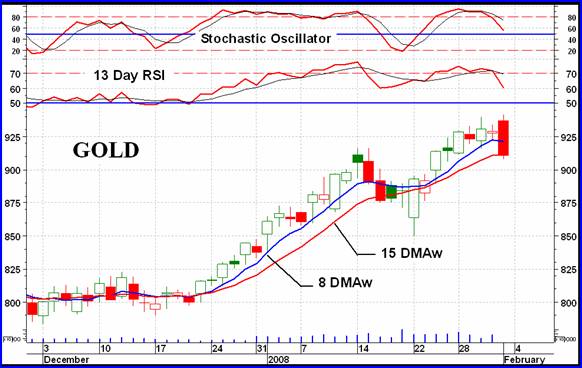
On 21 Dec gold started a short term upside move, with all indicators turning positive, that has continued until now. Although the indicators are still in their positive mode they are very much weakened and on the verge of going negative. It might take only another day or two and we may be in a bearish short term trend. For now the weakness is noted in the very short term moving average line already turning downward and both the short term momentum and Stochastic Oscillators well below their trigger lines. The high point for these momentum indicators was Monday. The action since then has been basically to the down side, more so than the actions of gold itself. The short term negative divergence in the momentum indicator was a warned before the Friday plunge. I would rate the short term, at best, NEUTRAL with a possible negative rating within another day.
NORTH AMERICAN GOLD INDICES
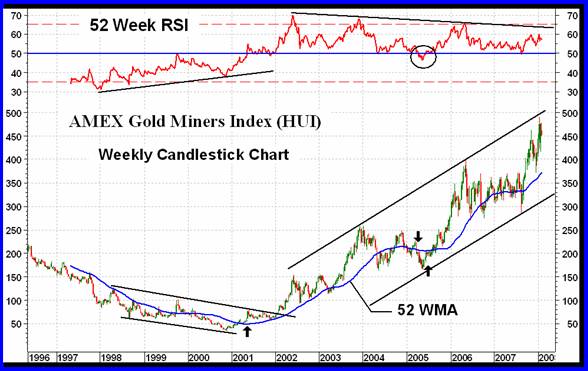
The chart this week is that of the AMEX Gold BUGS Index (HUI) from shortly after the top in 1996 to the present. It is what I call my very long term chart using a 52 week RSI as the momentum indicator and a 52 week simple moving average. By this chart my definition of a very long term bull or bear market involves both the indicator and the moving average being in sync. For a bull (or bear) market the indicator must be above (or below) its neutral line and the moving average slope must be positive (or negative). A reversal from one to the other takes place when BOTH are in sync in the reverse direction. One can't get any simpler than that.
What we see here is a very long term bear market in progress until a reversal occurred on 11 May 2001 at 61.46. Since then we have been in a very long term bull market with one very brief period (in 2005) where we got a reversal signal that lasted some 2 ½ months and then quickly corrected. The correction came at a slightly lower Index value than the reversal signal so from the Index stand point one did not lose any points in the whip-saw effect. The other major item from the chart is the momentum strength. We see that the momentum indicator was strengthening for years before crossing decisively into the positive. It has now been weakening for years but has not yet gotten to the point of crossing decisively into the negative. Another interesting but minor point from the very long term stand point is the location of the Index at the present time. It seems to be just below a resistance line that is drawn above previous peaks. We just might be in for a significant down side move but from the very long term point of view that is not important until we have a reversal validated, and that is some distance away.

I have often mentioned in my commentaries that the momentum indicator (long term, intermediate term or short term) was giving us a warning. Here we see why one does not jump to any immediate conclusions just because the momentum (strength) is weakening. This is a normal process in any trend. One needs to combine such warning along with other indicators before coming to a conclusion of any reversal of trend. Warnings are only that, a warning not a signal.
In summary, we may be in for some rough periods ahead but a very long term bear market is not yet in the works.
MERV'S PRECIOUS METALS INDICES
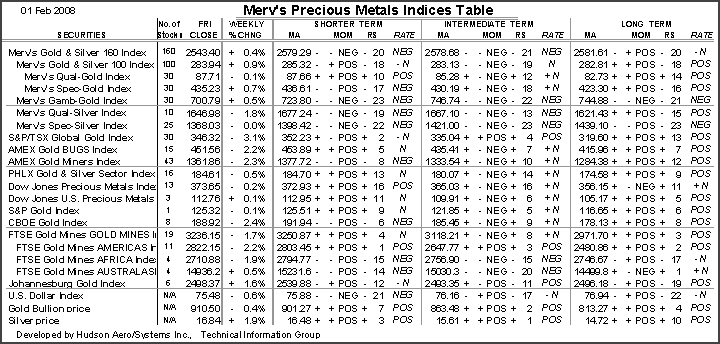
It's been basically a negative week in the precious metals with most Indices declining. In the North American markets the Indices that advanced were primarily those with the more speculative stock components. This week the quality stocks were the bummers. The overall Composite Index of Precious Metals Indices (based upon the Table component Indices) is showing signs of weakness although the Index itself has just recently made a new all time high. This high was not confirmed by the momentum indicator so we have a negative divergence warning on hand. I would expect that the individual Indices will give us a reversal of trend signal long before this Composite does so it is just an interesting view of the precious metals globally.
MERV'S GOLD & SILVER 160 INDEX
Here we get to the meat of the market. The universe of 160 precious metals (gold & silver) stocks closed the week on the up side, not by much but a plus anyway. The majority of stocks are on the speculative side so it was the more speculative stocks that made the grade. From the Sector Indices we see that this is so (more comments below). Although the Index closed higher there were more individual stocks closing on the down side than the up side, by about a 60/40 margin. The winners had reasonable gains while the losers had minimal losses with the resulting positive Index move. As for the summation of individual stock ratings, that changed very little from last week. We have the short term as a BEAR 54%, the intermediate term a BEAR 55% and the long term as NEUTRAL with neither bull nor bear in control.
From the chart and indicators we see that the Index is below negative sloping moving average lines for both the intermediate and long term. The intermediate term momentum is already in its negative zone while the long term is not quite there yet. I would therefore agree with the table ratings for these two time periods, i.e. BEARISH on the intermediate term and – NEUTRAL on the long term.
It's interesting to note that for the past year the universe of 160 stocks has not gone anywhere. We are just about where we were a year ago. During the past year the trend has been basically lateral. This could signify a long term topping activity or just a long rest period before the next upward thrust. Only time will tell which it is.
MERV'S QUAL-GOLD INDEX : MERV'S SPEC-GOLD INDEX : MERV'S GAMB-GOLD INDEX
The Qual-Gold Index was a loser this week but only by 0.1%, while the Spec-Gold and Gamb-Gold were winners, but also by less than 1% each. In all cases, however, there were more individual stocks closing lower than higher by about a ratio of 40% to 60%, give or take a few %. As for the summation of individual stock ratings, they moved slightly towards the negative for the Qual-Gold and slightly towards the positive for the Spec & Gamb-Gold Indices. This week's results are as follows:
Qual: short term NEUTRAL, intermediate term BULL 58%, long term BULL 68%.
Spec: short term BEAR 52%, intermediate term BULL 52%, long term BULL 52%.
Gamb: short term BEAR 58%, intermediate term BEAR 70%, long term BEAR 58%.
As for the charts and indicators, both the long and intermediate term are in the same technical position. Both are above their positive moving average lines and both have their momentum indicators in the positive zone. Both time periods are therefore rated as BULLISH .
As for the Gamb-Gold Index, it is below both its moving average lines and the lines are negative. The long term has a positive momentum while the intermediate term has a negative momentum. The long term is therefore rated as a – NEUTRAL while the intermediate term is rated as BEARISH .
SILVER
Silver seemed to have a good week being on the climb throughout the week until finally succumbing to a small decline on Friday. On Friday silver opened considerably on the up side but went nowhere and ended the day near its low for a loss. This is often considered by technicians as a one day reversal day so we might expect more down side action this coming week. Still, silver did make a new high with the volume indicator confirming the high. The momentum indicator held back just enough not to have made a new high and therefore it did not confirm the move. Silver has been in an intermediate term bull market since turning decisively to the up side in mid-September. It is still far away from an intermediate term reversal but that does not stop some negative short term moves. A move below $16.60 could result in such a short term move.
MERV'S QUAL-SILVER : MERV'S SPEC-SILVER
As with the gold sector Indices, the Qual-Silver Index closed lower than did the Spec-Silver Index did this past week. With its fewer component stocks the Qual had 2 winners and 8 losers for a 20% to 80% ratio. As for the Spec-Silver, it had 8 winners and 15 losers for a 32% to 60% ration, all still favoring the negative side. As for the summation of individual stock ratings, we get the following:
Qual: short term BEAR 60%, intermediate term BEAR 60%, long term BULL 50%.
Spec: short term BEAR 62%, intermediate term BEAR 64%, long term BEAR 50%.
The Qual-Silver Index is above its positive long term moving average line but below its negative intermediate term line. In both cases the momentum indicators are in the positive zone but weakening. From this we get a BULLISH long term but a BEARISH intermediate term rating.
All indicators are negative for both time periods for the Spec-Silver Index. Both periods are rated as BEARISH .
Merv's Precious Metals Indices Table

That's it for this week.
By Merv Burak, CMT
Hudson Aero/Systems Inc.
Technical Information Group
for Merv's Precious Metals Central
Web: www.themarkettraders.com
e-mail: merv@themarkettraders.com
Before you invest, Always check your market timing with a Qualified Professional Market Technician
For DAILY Uranium stock commentary and WEEKLY Uranium market update check out my new Technically Uranium with Merv blog at www.techuranium.blogspot.com .
During the day Merv practices his engineering profession as a Consulting Aerospace Engineer. Once the sun goes down and night descends upon the earth Merv dons his other hat as a Chartered Market Technician ( CMT ) and tries to decipher what's going on in the securities markets. As an underground surveyor in the gold mines of Canada 's Northwest Territories in his youth, Merv has a soft spot for the gold industry and has developed several Gold Indices reflecting different aspects of the industry. As a basically lazy individual Merv's driving focus is to KEEP IT SIMPLE .
To find out more about Merv's various Gold Indices and component stocks, please visit www.themarkettraders.com and click on Merv's Precious Metals Central . There you will find samples of the Indices and their component stocks plus other publications of interest to gold investors. While at the themarkettraders.com web site please take the time to check out the Energy Central site and the various Merv's Energy Tables for the most comprehensive survey of energy stocks on the internet. Before you invest, Always check your market timing with a Qualified Professional Market Technician
Merv Burak Archive |
© 2005-2022 http://www.MarketOracle.co.uk - The Market Oracle is a FREE Daily Financial Markets Analysis & Forecasting online publication.


