


Banking Index and Shanghai Stock Market Index at Critical Levels
Stock-Markets / Global Stock Markets Jan 31, 2008 - 09:28 PM GMTBy: Marty_Chenard

 We have previously pointed out that the financial and banking sectors are very important relative to the
S&P 500 for a very good reason ... and the reason is that financial's make up 20% of all the S&P 500 stocks.
We have previously pointed out that the financial and banking sectors are very important relative to the
S&P 500 for a very good reason ... and the reason is that financial's make up 20% of all the S&P 500 stocks.
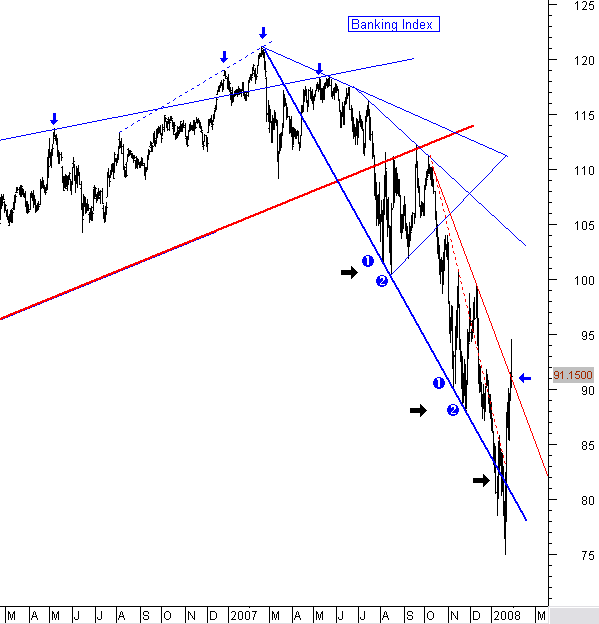
So, the first chart we will look at today is the Banking Index. The Index has been in a bear market since February of 2007 when it dropped from its peak. Like all down trends, the index has continued to make Lower/Highs and Lower/Lows.
A more serious down trend started in October of last year, which has given us a precipitous drop on the Banking Index. In spite of many S&P stocks with good earnings, the S&P has been negatively offset by a steep drop on the Banking Index.
So ... where are we now? There was a bit of hope (on the short term) in the past two days with the Banking Index closing above its downside resistance for the first time since October. While that is a glimmer of hope, one must not forget that the index remains in a technical downtrend since it has continued to make Lower/Highs and Lower/Lows. The Banking Index still has plenty of work to do in consolidating, finding a bottom, and getting through the new problem of Bond Insurer down grades.
Let's move on to the Chinese Market ...
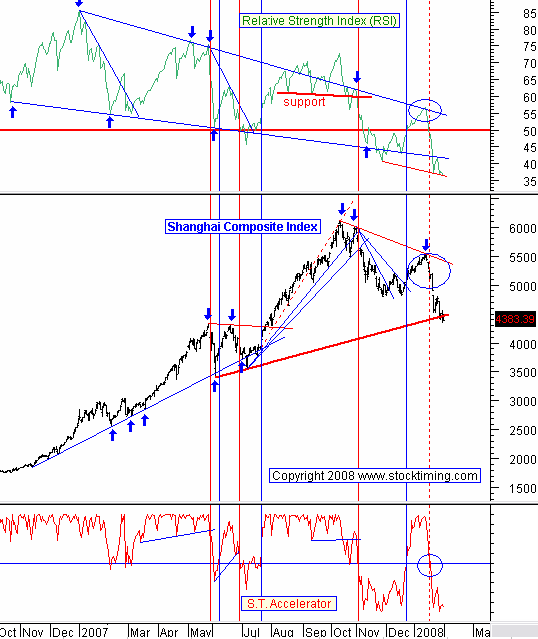
As we discussed yesterday, the Shanghai Composite is now at a major, critical support level as seen in the chart below.
Last night, the Shanghai Composite closed down -0.78% . This remains a critical level to hold, or the Shanghai could experience a precipitous drop from here. If that should happen, it would put a lot of downside pressure on our stock market as well. Investors should now keep an eye BOTH ... the Shanghai as well as the U.S. markets.
Comments: Note the Relative Strength graph at the top of the chart. The RSI appears to be holding a support line just as the Shanghai's price is at a major long term support test. So, this is the "big test" for the Shanghai Composite right now.
In spite of the RSI finding some support, our S.T. Accelerator is Negatively below its horizontal signal line and not showing any upside strength. If the S.T. Accelerator does not improve quickly, we will see an increased breakdown in the Shanghai's strength.
If you find this kind of data empowering and important relative to understanding where the market truly is , then why not consider joining us as one of our paid subscribers?
By Marty Chenard
http://www.stocktiming.com/
Please Note: We do not issue Buy or Sell timing recommendations on these Free daily update pages . I hope you understand, that in fairness, our Buy/Sell recommendations and advanced market Models are only available to our paid subscribers on a password required basis. Membership information
Marty Chenard is the Author and Teacher of two Seminar Courses on "Advanced Technical Analysis Investing", Mr. Chenard has been investing for over 30 years. In 2001 when the NASDAQ dropped 24.5%, his personal investment performance for the year was a gain of 57.428%. He is an Advanced Stock Market Technical Analyst that has developed his own proprietary analytical tools. As a result, he was out of the market two weeks before the 1987 Crash in the most recent Bear Market he faxed his Members in March 2000 telling them all to SELL. He is an advanced technical analyst and not an investment advisor, nor a securities broker.
Marty Chenard Archive |
© 2005-2022 http://www.MarketOracle.co.uk - The Market Oracle is a FREE Daily Financial Markets Analysis & Forecasting online publication.