


Managed money positions hint at bullish turns for gold and silver
Commodities / Gold and Silver 2012 Jul 16, 2012 - 03:47 AM GMTBy: Alasdair_Macleod

 I have recently written about the breakdown of disaggregated data from the futures markets into producers and swap dealers for gold and silver futures, as reported in the Commitment of Traders reports issued by the US government’s Commodity Futures Trading Commission (CFTC). There is a further category of trader to consider, and that is Managed Money.
According to the CTFC, “A ‘money manager’ is a registered commodity trading advisor (CTA); a registered commodity pool operator (CPO); or an unregistered fund identified by CFTC. These traders are engaged in managing and conducting organized futures trading on behalf of clients.” So it ranges from the advisory and discretionary clients of brokers and investment managers, to mutual and hedge funds. These are the users of the market who effectively represent the general public.
Managed money is often regarded as a contrary indicator, with good reason: the public is usually late on the scene, buying at the top and selling at the bottom, so a bullish chart would be one with a generally low level of long positions and a high level of short interest. Happily this is confirmed for both gold and silver in the charts below. First up is gold.
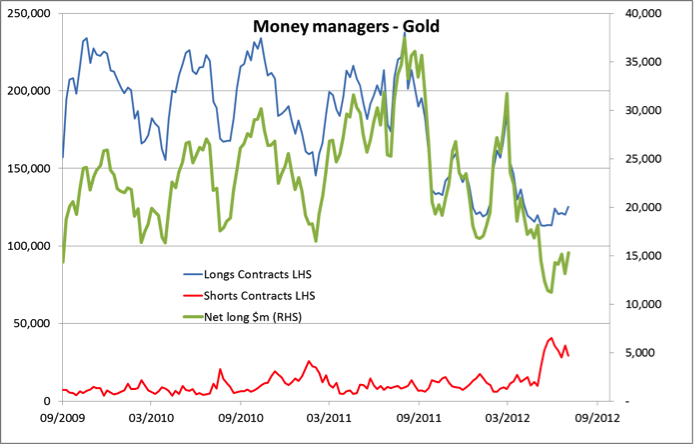
Extreme bullishness in the past was reflected in long positions (blue line) exceeding 200,000 contracts, while shorts (red line) remained very low. This has changed over the last year, with longs well under 150,000 contracts, and shorts at historically high levels. Contrarians will be pleased by these numbers, especially with the net long position (green line valued in USD – right-hand scale) at less than $15bn in value, having peaked at $38bn last August, indicating the market is oversold. What is not shown is that the number of money managers who are long has approximately halved from as high as 120 when the market was over-bought, to the current level of 67. Realistically, a level of 60 or 70 traders with long positions represents an unshakable hard core. Confirmation is to be found in the number of traders who are short, which is close to highs at 35, the all-time recorded high being 48 on June 26th , compared with a normal range of 15-20. In summary, this contrarian indicator is very bullish.
Now silver.
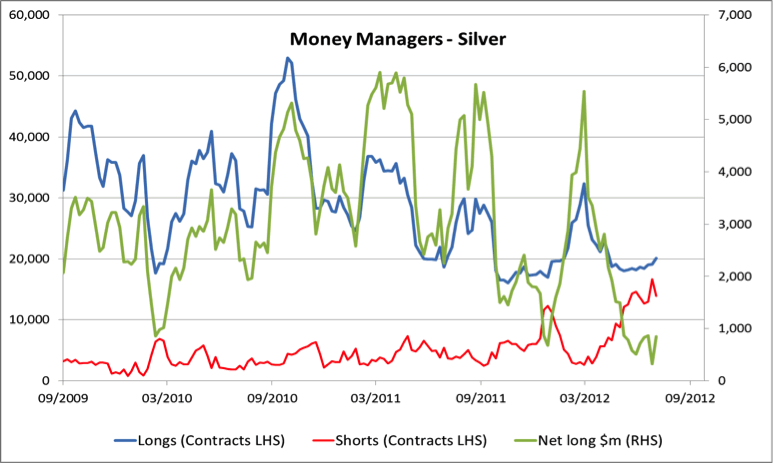
Long contract positions (blue line) have fallen from an extreme high of 52,960 contracts in September 2010 to current levels of about 20,000. Meanwhile, shorts (red line) have risen from a normal range with an upper bound of 7,500 contracts to current levels of about twice that. Adjusting the net figure for its dollar value (green line, right-hand scale) gives a total outstanding position of less than $1bn compared with previous bullish levels five times that. Furthermore, the number of traders with long positions has fallen from bullish levels of 50+ to half that today; and shorts have risen from less than 10 to nearly 30.
As a contrarian indicator, the managed money statistics for gold and silver as reported in the CTFC’s disaggregated data are the most bullish they have been since this data first became available in September 2009. As the wise old traders used to say, there are few sellers left to sell, just many buyers to buy.
Tags: Comex, gold price, silver price
Alasdair Macleod runs FinanceAndEconomics.org, a website dedicated to sound money and demystifying finance and economics. Alasdair has a background as a stockbroker, banker and economist. He is also a contributor to GoldMoney - The best way to buy gold online.
© 2012 Copyright Alasdair Macleod - All Rights Reserved
Disclaimer: The above is a matter of opinion provided for general information purposes only and is not intended as investment advice. Information and analysis above are derived from sources and utilising methods believed to be reliable, but we cannot accept responsibility for any losses you may incur as a result of this analysis. Individuals should consult with their personal financial advisors.
© 2005-2022 http://www.MarketOracle.co.uk - The Market Oracle is a FREE Daily Financial Markets Analysis & Forecasting online publication.