


How the Malaysian Government Manipulate the CPi to Undermine Inflation
Economics / Inflation Jul 16, 2012 - 03:30 AM GMTBy: Sam_Chee_Kong

 The Consumer Price Index measures the movement of goods and services purchased for consumption over a period of time. It is a very good measure for households to evaluate their financial position and purchasing power over time. As far as we know, folks like us knows that the prices of goods and services had risen much for the past few years and yet the government had been telling us the contrary. This is because according to their calculation based on the CPI, the basket of goods and services only goes up by 2-3% per annum. As we know all governments lies about their inflation figures. They will report inflation figures of 2-3% even though the prices of food, fuel, education, medical expenses and etc have been sky rocketing in the past few years.
Why CPI figure matters?
CPI figure has always been of importance to Government policy makers. Since the CPI is a measure of the price level of goods and services, it will help provide a good picture on the ‘temperature’ of the economy. Policy makers will need to know the condition of the economy whether it is over heated, under perform or just right? The Government will then use monetary policies like SDR, Interest rates and etc to influence the economy.
How to Calculate the CPI?
So how do we measure the Index? This can be complicated because literally there are thousands if not millions of goods and services out there. If we were to include every one of them in our calculation then it will be quite impossible to compute the Consumer Price Index. This is because the data collection and matrix of computation based on various weightings given to different products and services is just mind boggling. How can we solve the problem?
One way is to classify them ‘into a basket’ that will represent the majority of the products and services that will be consuming in a year. To illustrate on how to calculate the Consumer Price Index, we shall base our study on a fictional economy with the following assumptions.
- Only five products – Milk, Sugar, Flour, Honey and Salt
- It is a closed economy and new products are not added in
- Period of study is 3 years
- Total consumption is 1 unit per year (be it in kg or liter) for all products to simplify our illustration.
- Since there are only 5 products there will be no grouping under Food or Energy and etc.
Legend:
- The Total column is the total of all five products. For example in year 2000 the Total consumption is 12 which is (3+1+1.5+2.5+4).
- To obtain the Price Index you have to have a base year and in this case Year 2000 shall be our Base Year. So for year 2000 it is 100, 2001 is 110 and 2002 is 135.
- To obtain the inflation rate we will use the following formula.
Price increase = Cost of Basket current year/Cost of Basket Base Year x 100. So to compare the price difference between Year 2000 and Year 2001, we will obtain, (13.2/12) x 100 = 110. Hence the price index in 2001 had increased 10%. Similarly, a comparison of the prices between 2000 and 2002 yield a difference of 35 (135-100) and thus prices had increased 35% in two years. So by now we hope that you already have a grasp on how the CPI is being calculated before we move on to analyze the actual CPI of a country and in this case Malaysia.
Malaysia’s CPI classification
Malaysia’s CPI report is divided into 12 groupings which consist of about 460 itemized goods and services. The following is the CPI table as released by the Department of Statistics , Malaysia with the weights assigned to each of the 12 groups. The year 2010 is the base year and hence the value is set equal to 0 as per our example above. The full report can be read from this link.
http://www.statistics.gov.my/...
Table 1 : CONSUMER PRICE INDEX FOR MAIN GROUPS, MALAYSIA (2010=100)
Or can be shown graphically with the following Pie Chart.
Based on the above and the weights assigned to the main groups, the overall price increase is recorded at 2.7 % which can be shown by the following.
So based on the above the price increase from Jan 2010 – Jan 2011 is 1.8% (1.8 – 0), Jan 2010 – Jan 2012 is 4.5% (4.5 - 0) and from Jan 2011 to Jan 2012 is 2.7% (4.5 - 1.8). So does the inflationary figure (2.7%) represent the actual price increases of all the 460 items in the market place? Or could it be higher if not due to the Government’s manipulation of data, wrongly classification of groups and misleading weights assigned to the different groups?
What are the flaws in the CPI?
- Food accounted for too much weighting in the CPI
Based on the above Table, the Food and Non Alcoholic grouping accounts for 30.3% of the total CPI weighting. This can be quite considerable when we compare it with the rest of the world. The following chart is the for the food component as a percentage of the CPI for 25 countries around the world.
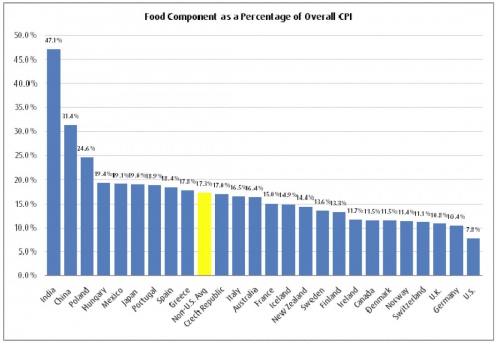
As you can see from the chart above when you take out the countries at both the head and tail end of the spectrum (India – 47.1% and US 7.8%) then the statistical bias will be reduced and it will provide a more accurate picture. After the adjustment the mean for Food Component of CPI in the 23 countries is about 17.3%. So Malaysia’s 30.3% food weighting in the CPI can be considered on the high end of the table after China’s 31.4%. The question is whether our 30.3% of the food component actually reflect the price rise in the CPI.
From Malaysia’s CPI table above the price difference in the food component from Jan 2011 to Jan 2012 only recorded a mere 4.8% increase. But according to FAO (Food And Agriculture) Organization of the United Nations, the price of basic food necessities around the world have increased by 28% for the past year. So can we conclude that it is due to Malaysia’s ability to managed its food production much better than the rest of the world or the FAO’s figure is inaccurate?
The above Table is the breakdown of individual items that comprises the Food and Non-Alcohol Beverages Grouping. Can anyone tell me what is ‘food away from home’ and the difference between it and the Restaurant in the 11th grouping? And why assign such a big weighting (30.3%) on it?
Anyone who has been to the wet market recently will tell you that as compared to last year’s prices of vegetables increased by more than 30%, seafood more than 30%, fruits more than 20%, milk and eggs certainly increased much more than 6.2%. Or in other words prices have increased more dramatically over the years.
Since sugar is one of the more important food items because it is used in almost all Food and Beverages, it is certainly flawed to assign a weight of only 0.59% together with Jam and Honey. As we know the price of sugar had increased by almost 100% since FELDA took over the business from Perlis Plantation a couple of years ago. Since sugar is used in most F&B, the ‘trickle down effect’ is certainly very great. Whenever there is an increase in the price of sugar, restaurants and food operators also took advantage by increasing their food prices. This will result in a ‘pass on inflationary’ effect on prices of other things even though there have no direct relation to sugar.
So what can we deduce from here is that the different weights assigned to the Food Grouping in the CPI classification is biased. More than 30% of the weighting on the Food Grouping comes from ‘Food away from Home’ which nobody seems to understand the nature of it. Fish, meat and vegetables are under represented because they only accounted for less than 10% of the total since they make up most of our daily expenses. It should account for higher than 10% if it were to reflect a more accurate representation of consumer expenses on food.
- Bias weighting in Housing,Water,Electricity,Gas and other Fuels.
The second grouping that is in dispute that we would like to discuss is the Housing,Water,Electricity,Gas and other Fuels. Before we go on let’s take a look at the items that consist the Housing grouping.
Source : Department of Statistics, Malaysia
The above are the items that represents the Housing,Water,Electricity and Gas Grouping. If we do not look into the breakdown of the Grouping then it might be justify to assign such a big weighting since it is also known as ‘Energy Grouping’. However as you can see most of the weighting goes to ‘Rental for Housing’ which was allocated a lion share of 17.24% out of the 22.59% or 76%. Electricity, Gas and other Fuels only take up 3.34% while the Water Supply share is 1.34%. Heck, since when rental is more important than Electricity and Gas in our daily expenses?
By putting less importance to Electricity and Gas and Other Fuels in the ‘Energy Grouping’ any price increase by the Government in Fuel and Electricity ‘will only have minimal impact’ on the overall grouping and hence the calculation of the CPI figure. Even with the rising of energy prices, it will have a less profound effect on the CPI because Electricity and Gas only takes up about 3.34% of the average Malaysian consumer expenditure.
- Health Group weighting is too low
Health expenses only accounted for 1.3% in the weightage of the CPI? The average income of a Malaysian household is about RM 14,016 per annum according to the Household Income Survey done in 2009. So based on the above statistics the average Malaysian household can only spend about RM 182 per annum (1.3% x RM14,016) on health expenses. Does this seem logical since health care cost has been ever rising for the past years? Again let us look into the details on the Health Grouping below.
Source : Department of Statistics, Malaysia
Is it justifiable to agree to the Department of Statistics that we spend only about RM182 per annum (yes, not per month) on medical expenses? As we know a visit to a private doctor (General Practitioner) will cost at least RM35 and was up from RM25 in 2009.
Another thing that is not mention is the ‘Medical Insurance’ expenses in the above Grouping. A look at the whole CPI classification also failed to mention medical insurance except in Misc Goods and Services in Grouping 12 where it mentioned life insurance (weigh 0.44%) and insurance connected to accident and health (0.14%). How can life insurance have more weight than health insurance when we spend much more on health than life insurance on our income? The big problem in under weighting the Health Grouping is because health care is the ‘biggest and most consistent’ source of inflation over the years.
- Education – Flawed in weightings
As for Education, it only accounted for 1.41% of the total. We believe that education in grossly under represented as the cost of education had going up in double digits especially in the tertiary level. The following is the breakdown of the Education grouping.
As can be seen from the above, the weights given to the different sub groups are clearly flawed. As a starter Education as a Main Group accounts for only 1.41% of the total CPI weights. Secondly Pre-Primary and Primary education seems to be given more weights than Secondary, Post Secondary and Tertiary education. Since when the Kindergarten and Primary Education are more important and take up more expenses than the secondary and tertiary education? Moreover tertiary education seems to have the least weights which indicates that it is less important and hence makes up the least on expenses in education. By right it should be exactly the opposite with most weights given to tertiary education with the rest o n the descending order. Damn lies, since when studying in Kindergarten cost more than studying in Universities?
- Restaurants and Hotels
The Restaurant and Hotel Grouping seems to be confusing. What is the difference with the Restaurant and cafes expenditure over here and ‘food away from home’ in the Food Grouping? Anyway below is the breakdown of the grouping.
Since our expenditure in Restaurants and Cafes take up quite a hugh chunk of our income when we eat out (unless you stay at home and cook), we feel that the weight that is assigned to Expenditure in Restaurants and Cafes is too low. As we all know eating out has always been getting more expensive these days. We feel that a higher weighting should be assign to this grouping (something like 8-10%) to reflect the changes in our lifestyles nowadays where people prefer to eat out than to cook at home.
- Transport
The next grouping that we are going to examine is Transport. The following is the table for the Main and sub-grouping of Transport.
In transport under the sub-grouping of 071 you will notice that there is a column for the purchase of motorcars. It is given a weighting of only 2.55 which we understood is well under represented. In actuality, monthly payments for vehicle hire purchase constitute more than 15% of the average household disposable income.
To illustrate further, we use the Perodua Myvi (a rebranding from Daihatsu) as our base calculation on monthly hire purchase payment since it is the best selling car among Malaysians. The low end version of the Myvi cost about RM44,400 and with the average household income of Malaysian at RM 14,016 (RM 1,168 per month). For a loan of 90% (RM 41,400) with a repayment duration of 9 years, consumers will have to fork out about RM466 per month for the hire purchase payments. Heck, since the monthly loan repayment take out about 40% (466/1168) of the disposable income, why is it only assigned a weighting of only 2.55? Moreover it also recorded a drop of -0.4%.
In Summary
The above are some methods that the government used to manipulate to CPI data so as to under report the actual inflation rate. There following are also the fundamental flaws methods that the government use to suppress the CPI value and hence the inflation rate.
- The Chain weighting system.
What is chained CPI? Chained CPI is actually the grouping of a few years CPI figures and average them up. The end result will be the reduction in the CPI figure because instead of using the traditional basket of goods as a base for calculation the chained CPI. Say for example the inflation rate for 2008 is 5%, 2009 is 6% and 2010 is 7%, so by chaining them together will give us an average figure of 6% for the 3 years. The end result will be the under reporting of the CPI index by up to 30%.
- Neglect to take into consideration of substitutes. Due to the price increase, consumers will ways to adjust their lifestyles by substituting lower quality products for higher quality ones. For example when the price of imported beef form Australia increased by 20% then cost conscious consumers will automatically switch to cheaper substitutes which may be the Local beef or imported Indian Beef which command a lower price. As a result of the increased demand for cheaper substitutes, it will also caused a price increase. However we afraid that such increase in price is not recorded in the CPI calculation because the breakdown in Meat in the Food grouping only consist of fresh, frozen or processed meat.
Since Meat is broken down into Fresh, Frozen or Processed then any increased in the price of substitutes might not be included into the CPI calculation. Furthermore not all prices move in the same amount and direction further complicates the calculation for the CPI. The Meat sub-grouping can be further breakdown into Beef, Chicken, Lamb, Pork and etc. For all you know, the price of Chicken may move up faster during the certain time of the year or because there is a short supply of chicken due to the foot and mouth disease. Similarly the price of beef might go down because one of the importers had ordered a hugh consignment from India and hence create an over supply situation.
- The basket of goods consists of too few items. In America, the basket of goods from the Bureau of Labor Statistics (BLS) consists of more than 80,000 items. In Malaysia under the Department of Statistics their basket of goods only consist of about 460 items which we believe is very under represented and that is why on most sub-grouping like meat, fish, fruits and etc there are no further breakdown. By not increasing the number of goods and services in the basket, it can manipulate the CPI rate more easily because the movement and price changes of many items can be under reported or better still be ignored.
Any solution to counter higher inflation?
The Government can claim that there is a low inflation rate of 2-3% because we as the consumers are adjusting our lifestyles. Instead of eating out 4-5 times a week, now we can only afford to eat out only once or twice a week due to increasing cost. Hence when we cook more at home and eat out less, the government can claim that the overall food costs have decreased.
So in the end we can conclude that it is the Government that is controlling and manipulating the CPI figure so as to under reporting the inflation rate. Since the calculation of the CPI is based on the basket of goods and services that will reflect the patterns of consumer spending hence its movement is also subjected to Supply and Demand economics.
Increase Supply
One way to help reduce prices is to increase the supply of the goods and services that is experiencing a price hike. For example, to reduce the ever increasing health cost the government can build hospitals, clinics and also engage more doctors. We do have what they call the ‘1Malaysia Clinic’ which charges only RM1 per visit but most unfortunately you can hardly find any doctors attending to them most of the time.
Similarly to address the problem of the increasing cost in education , the government can either build more schools and universities or provide more cheap loans to students. Since future economic growth varies directly to today’s investment in human capital more emphasis should be given to education.
Take China for an example, for the past decade China had been investing heavily in the education sector to the tune of hundreds of billion of dollars or more than 1.5% of GDP annually. Since the last decade the amount of higher education institutions had more than doubled from 1022 to 2263. Under Project 211 initiated during 1995 about 100 Universities are selected for the program where special funding will be allocated. The main aim is to raise the Research Standards of the Universities and also the same time cultivating social economic developments. You will be surprised that studying in China is cheaper than in Kuala Lumpur. Due to the economies of scale in education the tuition fees at China’s top Universities come to less than US4000 per annum.
According to the President of Yale University Professor Richard Levin, in 25 years time Chinese Universities would rank in the world’s top 10 Universities with Tsinghua (49 at the moment) , Beijing and Fudan Universities leading the way. He also added that by then Chinese Universities will rival the Ivy League and Oxbridge universities. Over here things are going exactly the opposite where the rankings of the local universities kept falling due to its ineffective education policies and also its choice of teaching staffs that favors certain ethnicity.
Issue more Permits
For essential items like rice and sugar, the government can help reduce their prices by issuing more import permits to more companies instead of relying on one company that holds the monopoly on import permits. In Malaysia the rice trade is basically controlled by Bernas which is owned by a political crony while the sugar trade is controlled by FELDA after acquiring Robert Kuok’s interest. Additionally the government can award more TOL (temporary permits) to farmers to farm idled or unused land so that the national food bill can be reduced since food consist of more than 30% in the CPI weighting.
Remove Trade Barriers
Another way to reduce the cost of living is to get rid of trade barriers and reduce import taxes on vehicles. Due to its protectionism policy and the government’s intent to protect its local car venture (Proton), it imposed hefty import taxes (more than 100%) on imported cars. As a result it put a heavy burden on its people by having to pay expensive hire purchase payments. Since the National car industry is bleeding red ink year after year it will be a futile attempt to keep it a going concern. It might be a better policy to scrape the project completely and at the same time reduce the import taxes on imported cars. By reducing the price of imported cars it will lessen the burden of the people by paying less hire purchase payments and hence more money available to spend on other things.
In conclusion
The statistics provided by the Department of Statistics does have many questionable and controversial weightings in their formulas and hence does not provide a true picture of the actual inflation rate. If not due to the manipulation of the CPI value through biased weighting and grouping, the inflation rate would be much higher than the reported 2.7%. If they could have reclassified the groupings and weightings then we believe the actual inflation rate could be as high as 8% which is three times the current rate. We believe that a better and unbiased model to calculate the CPI would be the one that can include as many goods and services as possible.
One good model would be the Billion Prices Project (BPP) developed at MIT by Professors Rigobon and Cavallo. This model tracks more than 1 million goods and services both online and offline. Data are collected daily from online retailers by using a computer software to scan through the web for updated retail prices and store in a database. The result will be an array of products that are sold by online retailers and is included ‘in a basket of goods’ which could be used to calculate the real time, daily, weekly, monthly and yearly CPI figures. In other words it can provide high frequency inflation data across countries and sectors. So by tracking millions of product and services in real time it represents better distributed weightings and an unbiased view of the CPI.by Sam Chee Kong
cheekongsam@yahoo.com
© 2012 Copyright Sam Chee Kong - All Rights Reserved
Disclaimer: The above is a matter of opinion provided for general information purposes only and is not intended as investment advice. Information and analysis above are derived from sources and utilising methods believed to be reliable, but we cannot accept responsibility for any losses you may incur as a result of this analysis. Individuals should consult with their personal financial advisors.
© 2005-2022 http://www.MarketOracle.co.uk - The Market Oracle is a FREE Daily Financial Markets Analysis & Forecasting online publication.