


Euro Zone Crisis Vs the Stock Market 4 Year Cycle
Stock-Markets / Cycles Analysis Jul 13, 2012 - 05:51 AM GMTBy: Clif_Droke

 Investors are worried that this summer will witness a repeat of the summer debacles of 2010 and 2011. The stock market has itself vulnerable to negative news from overseas as well as earnings disappointments. Is the market’s recent behavior a portent of worse things to come? In this commentary we’ll try and determine whether the market will fulfill the bears’ expectations or disappoint them.
During the last two summers the stock market was vulnerable to the initial flare-up of the Greek debt crisis. The 2010 summer decline was of course initially catalyzed by the “flash crash” on Wall Street. This summer we have a major election on the immediate horizon with an incumbent president seeking re-election. This fact alone points to a concerted effort on the part of vested interests at keeping the financial market as stable as possible heading into November.
A good place to start in our quest at finding an historical pattern similar to the market environment we’re currently in is the year 2004. You’ll recall that 2004 had the distinction of being a presidential election year with a sitting president seeking re-election, much like today. There was also a similar level of broad market weakness during the spring and summer of that year.
The SPX initially bottomed in May ’04 and made a rather sloppy looking attempt at a double bottom with a slightly lower low by early August – just in time for “election season” to begin. From that point the SPX took off, zooming up to a new high by the November election and commencing the bull market that began the year before. Not surprisingly, the incumbent president won re-election.
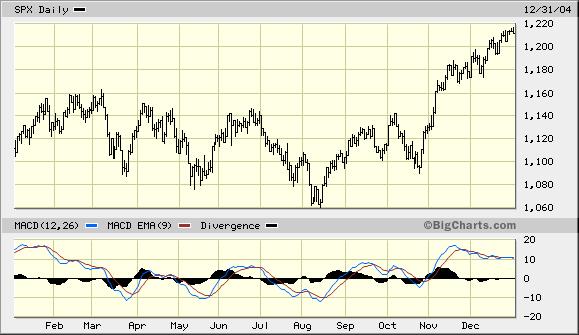
The 2004 pattern is also instructive in that the SPX made its initial high in March before experiencing a 5-month correction. This year the market also peaked in March and has experienced a 3 ½-month correction to date. Although some additional “correction” work may be needed to complete the bottoming pattern, I’ll reiterate that I don’t believe a re-test of the June 1 low is needed. Also, based on the weekly cycles I don’t believe it’s necessary that the current bottoming/correction pattern needs to be dragged out until early August as it was in 2004. If the current internal momentum currents are any guide, the current bottoming pattern could be complete in just a few more days.
The 4-year so-called “presidential cycle” teaches us that if a stock market correction continues past the month of August, an incumbent president (or the political party of a sitting president) is in trouble. For instance, in the 2000 election the sitting president – a Democrat – was leaving office. His successor ended up losing a closely contested race which was ultimately (and infamously) decided by the Supreme Court. The stock market, however, gave a clue as to who would win the race before it was decided. Both the Dow and the S&P tumbled in September and October 2000 ahead of the election, which helped turned the tide of public opinion against the Democrats and gave the Republicans the advantage.
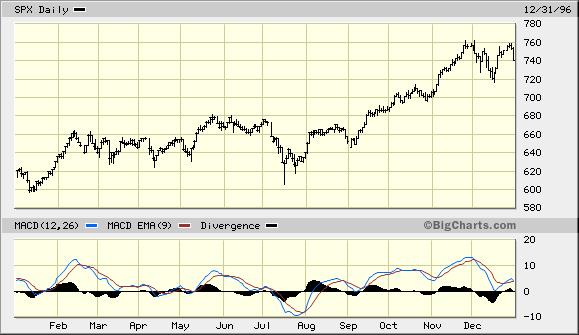
The opposite was true in the presidential election of 1996. In that year, the incumbent president was a Democrat and he easily won re-election. His victory was sealed when, despite a summer correction, the S&P rallied in September and October right up into the election.
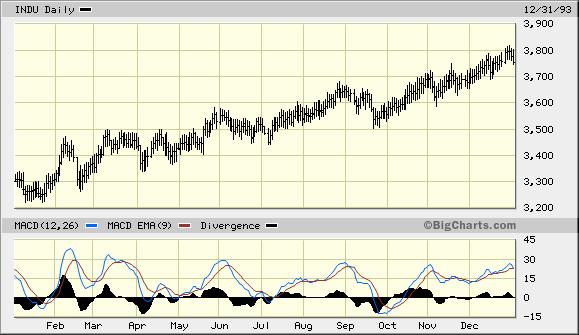
Let’s look at another example of this 4-year presidential cycle phenomenon. Back in 1992 the incumbent president running for re-election was a Republican. The race was actually a 3-way race with an independent candidate involved, and it was actually fairly close heading into Election Day. What ultimately did the incumbent in, however, was the perception that the economy was weak and getting weaker. This was underscored by investors’ focus on the August-October 1993 decline in the Dow Industrials. This essentially sealed the president’s fate as he lost in November.
Two more election years are worth mentioning. The election year 1988 saw the traditional July-August stumble in the stock market before a September-October rally to a new high for the year heading into the November election. The incumbent party (Republicans) won the presidential election that year. In election year 1984 the stock market was weak from January through the end of July. But a sharp rally which began in August and culminated during election week of November that year assured the incumbent president of a re-election victory, per the historical pattern.
In view of the 4-year presidential cycle considerations listed above, it’s unlikely that the current regime will allow a sell-off the magnitude of either the May-July 2010 decline or the July-August 2011 mini crash. A worst case scenario for summer 2012 would be the summer 2004 stock market pattern mentioned earlier.
2014: America’s Date With Destiny
Take a journey into the future with me as we discover what the future may unfold in the fateful period leading up to – and following – the 120-year cycle bottom in late 2014.
Picking up where I left off in my previous work, The Stock Market Cycles, I expand on the Kress cycle narrative and explain how the 120-year Mega cycle influences the market, the economy and other aspects of American life and culture. My latest book, 2014: America’s Date With Destiny, examines the most vital issues facing America and the global economy in the 2-3 years ahead.
The new book explains that the credit crisis of 2008 was merely the prelude in an intensifying global credit storm. If the basis for my prediction continue true to form – namely the long-term Kress cycles – the worst part of the crisis lies ahead in the years 2013-2014. The book is now available for sale at: http://www.clifdroke.com/books/destiny.html
Order today to receive your autographed copy and a FREE 1-month trial subscription to the Gold & Silver Stock Report newsletter. Published twice each week, the newsletter uses the method described in this book for making profitable trades among the actively traded gold mining shares.
By Clif Droke
www.clifdroke.com
Clif Droke is the editor of the daily Gold & Silver Stock Report. Published daily since 2002, the report provides forecasts and analysis of the leading gold, silver, uranium and energy stocks from a short-term technical standpoint. He is also the author of numerous books, including 'How to Read Chart Patterns for Greater Profits.' For more information visit www.clifdroke.com
© 2005-2022 http://www.MarketOracle.co.uk - The Market Oracle is a FREE Daily Financial Markets Analysis & Forecasting online publication.