The Supply Side of Crude Oil
Commodities / Crude Oil Jul 13, 2012 - 02:45 AM GMTBy: Elliot_H_Gue

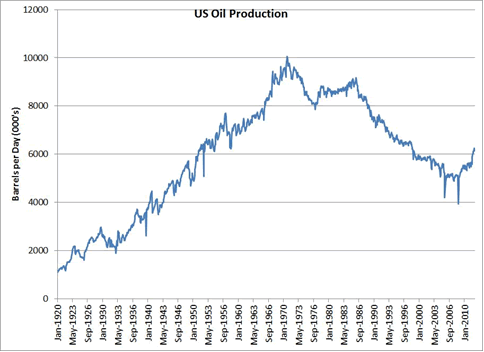
 Oil supply growth from countries outside OPEC should grow by roughly 660,000 barrels per day, with North America accounting for much of this uptick in production. Preliminary data from the US Energy Information Administration indicates that domestic crude oil production in April surged by 567,000 barrels per day from year ago levels. Robust drilling activity in unconventional plays such as the Bakken Shale in North Dakota and the Eagle Ford Shale in south Texas fueled much of this growth.

Source: Energy Information Administration
US crude oil production is rising for the first time since the 1980s, a sea change that’s reduced the nation’s dependence on oil imports. Even better, the US now enjoys lower energy prices than any other major developed economy in the world.
However, investors should disregard the fallacious argument that global oil prices will decline because of surging output from US shale plays. There’s an old saying in the energy industry that it’s harder to grow oil output than gas production.
Let’s put the increase in US oil production in context. Current oil production amounts to about one-third of domestic demand; the nation is a long way from altogether weaning itself off foreign oil.
In contrast, the US is already the world’s largest producer of natural gas and doesn’t require imports to meet domestic demand; in fact, the country will likely become a significant exporter of natural gas before the end of the decade.
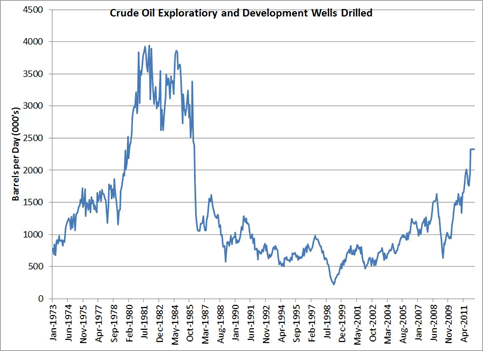
The increase in crude oil production witnessed over the past few years has been far from easy or inexpensive. Over the past decade, the number of wells drilled for crude oil in the US has surged from between 500 and 700 wells per month to well north of 2,000 wells per month.

Source: Energy Information Administration
Much of this acceleration in drilling activity has occurred over the past three years. More than 1,300 rigs are actively drilling for crude oil in the US, up from a 2008 peak of just 426 rigs.
US oil production could ramp up even faster in coming months, as development accelerates in the deepwater Gulf of Mexico. However, if oil were to trade in the low to mid-$70s per barrel, producers would likely moderate output because of cost inflation.
The picture is far less rosy outside North America. According to the IEA, unplanned production outages in non-OPEC nations totaled almost 1.3 million barrels per day in the second quarter.
For example, output from the North Sea has declined because mechanical problems, a gas leak in the Elgin field and labor strikes. Meanwhile, a production transportation dispute between Sudan and South Sudan has brought oil output to a standstill, while production in Yemen and Syria has declined because of civil unrest and sabotage to crude oil pipelines.
Although outages related to oil sands production in Canada are fading and North Sea production should normalize in the second half of the year, outages will still total more than 1 million barrels per day by the end of 2012.
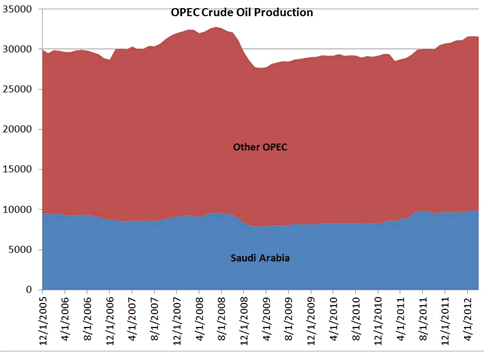
With rising oil demand outpacing non-OPEC supply growth, the world depends heavily on OPEC production to balance the market. To date, OPEC has flowed more than enough oil to meet demand.

Source: Bloomberg
Overall, OPEC oil supply was up 2.25 million barrels per day in June, led by an increase in Libyan oil output from less than 300,000 barrels per day a year ago as the country’s production recovers from last year’s civil war. Recent data suggests that Libyan output is now close to its pre-war level of 1.6 million barrels per day and the nation has recovered surprisingly quickly from last year’s outages.
But Saudi Arabia has also been an aggressive producer so far in 2012, with output topping 10 million barrels per day in each of the past three months–up about 1.1 million barrels per day from the same time last year. Some of Saudi Arabia’s excess production represents efforts to boost oil supply to offset the impacts of sanctions against Iran that went into effect starting on July 1. Iran has maintained production to date, but much of its output is flowing into storage, with exports down about 1 million barrels day since the end of 2011. At some point sanctions will negatively impact the country’s ability to export crude oil and storage will fill up, forcing the nation to cut actual production.
Saudi Arabia is unlikely to maintain production at recent levels if Brent oil prices were to continue to fall significantly under $90 per barrel. And the nation may slice output given the pick-up in Libyan production or if it feels Iranian output will be stronger than the market expects. Prices around $100 per barrel on Brent appear comfortable for Saudi Arabia as they’re high enough to generate considerable profits but low enough to limit the impact on global demand. Moreover, to increase its production, Saudi Arabia has simply dipped into spare production capacity; OPEC spare capacity continues to hover at under 3 million barrels per day, with about 1.9 million barrels per day of that capacity in Saudi Arabia. OPEC’s spare capacity position is tighter than it was at the same time last year; in May 2011 spare capacity stood at about 4.4 million barrels per day.
Oil Markets Remain Tight
US inventories of crude oil have swelled because of a glut in Cushing, Okla., the official delivery point for WTI. US crude oil stockpiles stand at 387.2 million barrels, up almost 8 percent from a year ago, while the oil supply at Cushing has ballooned by 26.4 percent.
Meanwhile, gasoline inventories slipped about 4 percent on a year-over-year basis, while inventories of distillates–diesel and heating oil–are down roughly 20 percent.
This surfeit of oil accounts for the widening price differential between WTI and Brent crude oil. Enbridge (NYSE: ENB) and Enterprise Product Partners LP (NYSE: EPD) recently completed their reversal of the Seaway Pipeline, which should alleviate this bottleneck by transporting oil to the Gulf Coast from Cushing. But the pipeline doesn’t yet operate at its nameplate capacity, and it will take time to work through excess supplies.
Far too many investors extrapolate the US experience to other regions of the world; most major oil-consuming nations face tighter inventories, a trend that’s evident in the shape of the Brent crude oil futures curve.
Brent futures for August delivery trade at $96.30 per barrel, but futures expiring in six months fetch $95.75 per barrel. When near-term futures command a higher price than futures expiring further into the future, the market is in backwardation.
Currently, the market for WTI is in contango. That is, near-term oil futures trade at a discount to longer-dated contracts. This imabalance suggests that supply shortfalls are unlikely in the near term, which is why spot prices are relatively low. Markets in contango also encourage traders to purchase oil for storage in the spot market and sell that at higher future prices.
In contrast, backwardation indicates a tight supply-demand balance in the near term.
The contrast between the shape of the futures curve for Brent and WTI speaks volumes about supply and demand conditions in these two markets. In particular, the US market is relatively well-supplied, while the balance in Europe and Asia look tight despite softening demand.
The fundamentals in the global oil market haven’t shifted to the extent suggested by the recent decline in prices. Investors have fixated on the potential for a global economic slowdown to reduce crude oil demand, but emerging-market consumption remains robust. The decline in EU oil demand won’t have much of an impact on the global market.
Unless the US joins Europe in recession–an unlikely scenario–global demand growth will likely exceed non-OPEC supply, leaving OPEC to fill in the gap. I don’t expect Saudi Arabia and the rest of OPEC to maintain production at current elevated levels if prices decline further.
Against this backdrop, crude oil prices appear close to a bottom. Although a selloff in equities markets could lead to further downside for oil prices, Brent crude oil should find support at the mid- to high $80s per barrel and WTI should find support in the mid- to high $70s per barrel.
Uncover five energy stock picks resistant to swings in the price of oil by checking out my free Top MLP Investments report.
Mr. Gue is also editor of The Energy Strategist, helping subscribers profit from oil and gas as well as leading-edge technologies like LNG, CNG, natural gas liquids and uranium stocks.
He has worked and lived in Europe for five years, where he completed a Master’s degree in Finance from the University of London, the highest-rated program in that field in the U.K. He also received his Bachelor’s of Science in Economics and Management degree from the University of London, graduating among the top 3 percent of his class. Mr. Gue was the first American student to ever complete a full degree at that business school.
© 2012 Copyright Elliott H. Gue - All Rights Reserved
Disclaimer: The above is a matter of opinion provided for general information purposes only and is not intended as investment advice. Information and analysis above are derived from sources and utilising methods believed to be reliable, but we cannot accept responsibility for any losses you may incur as a result of this analysis. Individuals should consult with their personal financial advisors.
Elliott H. Gue Archive |
© 2005-2022 http://www.MarketOracle.co.uk - The Market Oracle is a FREE Daily Financial Markets Analysis & Forecasting online publication.


