US-Economy on Brink of “Double-dip” Recession as Computer Cowboys Invade Commodity Markets
Stock-Markets / Financial Markets 2012 Jul 12, 2012 - 03:02 PM GMTBy: Gary_Dorsch
 For most of Wall Street’s history, trading in equities was fairly straightforward: buyers and sellers gathered on exchange floors and haggled until they struck a deal. Computerized trading of stocks didn’t arrive onto the Wall Street scene until the 1980’s. Computer guided “Program trading,” - defined by the NYSE as an order to buy or sell 15-stocks or more, valued at over $1-million total, was blamed for the “Black Monday” Crash of October 1987. Then, in 1998, the internet opened-up markets to anyone with a desktop computer, and a trading idea. Since then, computer trading programs have grown vastly more powerful and the algorithms that guide their trading vastly more sophisticated.
As such, the average PC trader is no longer able to compete with Wall Street’s computers. Powerful algorithms, called “Algos,” in industry parlance, are executing millions of orders a second and scan dozens of public and private marketplaces simultaneously. Algorithms can spot trends in the global markets, evaluate and integrate the latest news releases, changing orders and strategies within milliseconds, before PC investors can blink.
As the use of algorithms moves from hedge funds and Wall Street’s trading desks to mutual- and pension-fund managers, these computer guided trades now account for roughly 60% to 70% of total US-equities trading volumes on the NYSE, Nasdaq, and electronic markets, known as Dark Pools. As a result, many banks and brokerage firms have been able to slash their trading desks’ staff in half, while more than doubling their equity trading volume.
There’s a special class of algorithmic trading, called, “high-frequency trading” (HFT), in which computers buy and sell equities based on information that is received electronically, before human traders are capable of processing the information. High-frequency traders (HFT) operate in the shadows, often in quiet places located far from Wall Street, and trading stocks at warp speed. HF traders move millions of shares around in minutes, yet only seeking to profit by “scalping” a few pennies off each share.
Over the past few years, high speed traders have deployed algorithms more widely, and have become bigger players in commodity futures, foreign currencies, international stocks, and exchange traded funds. According to the Chicago Mercantile Exchange, - roughly 35% of all commodity futures trades is now handled by high speed computerized traders. That figure is expected to reach 60% of commodities trading volumes in the years ahead.
Computer Cowboys Invade Crude Oil Pits, With so many moving parts in the global financial markets, moving at faster and faster speeds, it’s no wonder that commodity fund managers are increasingly turning to Algos. Today, HFT and computer-generated trades account for 35% of the volume in Nymex energy futures. Even longer-term Macro traders that hold positions for weeks or months are turning to Algos to collect and analyze a wide range of data, such as interest rates, employment numbers, purchasing managers’ statistics, Chinese oil imports, corporate earnings, global GDP figures, etc, at millisecond speeds. Algos can read and evaluate 175 economic indicators at any moment in time, before firing off a trade.
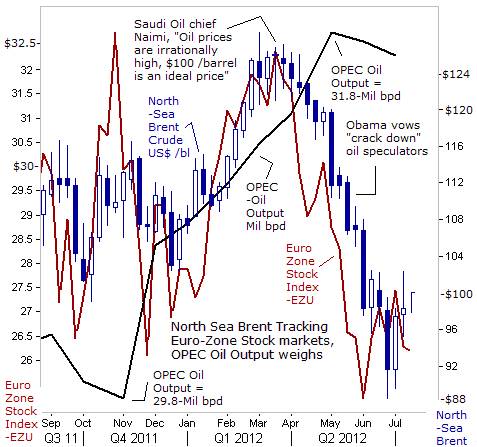
How can the average investor hope to outsmart an Algo trader? Fortunately, computerized trading is mostly used in scalping operations, providing massive liquidity to the markets, but isn’t altering the market’s longer term mega-trends. In fact, Algos appear to be utilizing traditional tools that have been used for decades, and are in sync with today’s “Financialization” of the commodity markets. That is to say, Algos are reinforcing the “inter-market” relationships between currencies, interest rates, global equity markets, and the commodities sector, - most notably, metals and crude oil. Such was the case over the past year, when the gyrations of the Euro-zone’s equity indexes, and the Euro’s exchange rate against the US$, were key drivers influencing the price of North Sea Brent crude oil.
For example, since peaking in mid-March, the exchange traded fund for the Euro-Zone’s broad stock market index, (NYSE ticker: EZU), has fallen sharply, from as high as $32.50 /share to around $25 today. EZU has suffered a “double whammy,” including the Euro’s 10% slide against the US-dollar. Thus, EZU is a key Algo indicator for crude oil traders, since it tracks the Euro-zone equity markets, - a real time barometer of the market’s outlook for the Euro-zone’s economy, and is incorporates the Euro’s exchange rate. In turn, EZU’s slide to $25 per share, has weighed heavily on Brent’s tumble to below $100 per barrel.
Two other key variables that should be analyzed, are (1) the amount of crude oil that’s supplied by Saudi Arabia and the OPEC cartel, and (2) the direction of the Euro versus the US$. Although its influence has waned over the past few decades, the Saudi royal family is still the chief central banker of the crude oil market, and is the swing producer of the OPEC cartel. Riyadh says it has 2.5-million barrels per day (bpd) of spare capacity that can be pumped into the market at a moment’s notice, to either cap prices or knock prices lower. It’s interesting to note, that the peak in the North Sea Brent crude oil market, at $127 per barrel, did coincide with a stern warning from Saudi Arabia’s oil chief, Ali al Naimi.
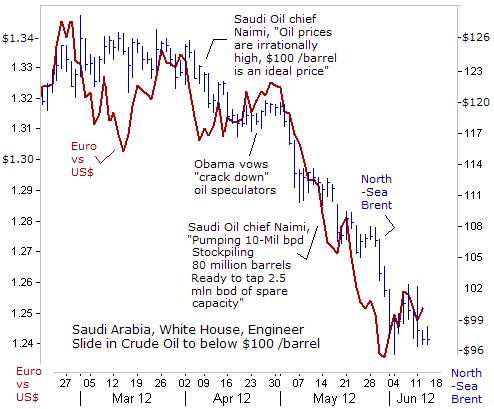
Writing a rare opinion piece in the Financial Times on March 28th, Naimi blasted “irrationally high oil prices,” saying there was no shortage of supply, and that Riyadh was ready to use its spare production capacity “to supply the oil market with any additional required volumes,” he warned. “Supply is not the problem, and it has not been a problem in the recent past. There is no rational reason why oil prices are continuing to remain at these high levels ($127 /barrel). I hope by speaking out on the issue that our intentions – and capabilities – are clear. We want to see reasonable crude oil prices. Saudi Arabia will do what it can to mitigate prices. The bottom line is that Saudi Arabia would like to see a lower price,” he warned. Earlier, Naimi identified $100 a barrel as an ideal price for producers and consumers.
To make this happen, Saudi Arabia boosted its oil output over the next few months to a record 10.1-million bpd, and lifted OPEC’s combined oil output to 31.8-million bpd in April – or 1.8-million above OPEC’s stated quota, thus greasing the skids under North Sea Brent. On May 8th, Naimi first indicated that the Saudi kingdom was pumping 10-million bpd and was also storing 80-million barrels to meet any sudden disruption in supplies. “In addition to our spare capacity of 2.5-million barrels per day, we have on the ground, in tanks and in pipelines, about 80 million barrels of inventory. These are working inventory,” Naimi said.
Following Naimi’s initial warning, on March 28th, the price of North Sea Brent tumbled $40 per barrel lower to $88 per barrel in June, before rebounding to around $100 today. Coinciding with crude oil’s slide to below $100, was a slide in the Euro’s value from as high as $1.34 in early March to as low as $1.2350 in late May. Traders reckon that Riyadh would try to put a floor under North Sea Brent at around $84 per barrel, which is the estimated “break-even” point, that’s necessary for Riyadh to finance is domestic spending programs.
The Euro’s Sharp Slide against the US$ has been a thorn in the side of the commodity markets for the past 14-months. The Continuous Commodity Index, (CCI) measuring a basket of 17-equally weighted commodities, stumbled into bear market territory on June 20th, soon after the Federal Reserve balked at launching a third round of quantitative easing (QE-3). The CCI fell as much as -27% from last year’s high, when it skidded to the 500-level, its lowest since November 2010. In turn, the Euro’s slide from as high as $1.4850 in April ’11 to $1.2150 today, a drop of -18%, and was a major catalyst behind the CCI’s demise.
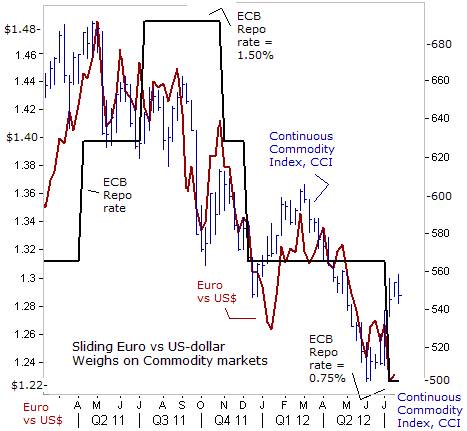
The Euro also fell to record lows against the Australian and New Zealand dollars, after the ECB lowered it repo lending rate to a record low of 0.75% on July 5th. Traders expect more ECB rate cuts and another injection of cheap, long-term loans (LTRO) for banks. The Euro also fell to a 3-½ year low against the British pound and a 10-year low against the Chinese yuan on July 9th. The People’s Bank of China (PBoC) lowered its 1-year loan rate within minutes of the ECB’s rate cut, but failed to stop the Euro’s slide versus the yuan.
Europe is the world’s biggest buyer of goods and services, buying 31% of all global exports. However, with the Euro losing its purchasing power against most major currencies, European consumers could be forced to cutback on purchases of foreign imports. Unemployment in the Euro zone has reached a record high of 11.1% in May, - a full 1% higher than in April 2010, and is also denting consumer spending. The jobless rate is likely to climb higher in the coming months, as depression like conditions in the peripheral Euro-nations spreads to the core. Manufacturing in kingpin Germany, is already showing signs of stagnation.
The Euro-zone’s record jobless rate is the result of the austerity measures imposed by Germany, the IMF and the troika upon the so-called Club-Med nations. These brutal measures are making the working class pay for balancing budget deficits, while crony politicians transfer taxpayer monies from state treasuries into the coffers of the European banking Oligarchs that are receiving a bailout. In Greece, value added taxes have been sharply raised, pensions have been slashed, and hundreds of thousands of workers have been laid off in both the public and private sectors. Similar austerity policies have been imposed in Spain, Portugal, and Ireland.
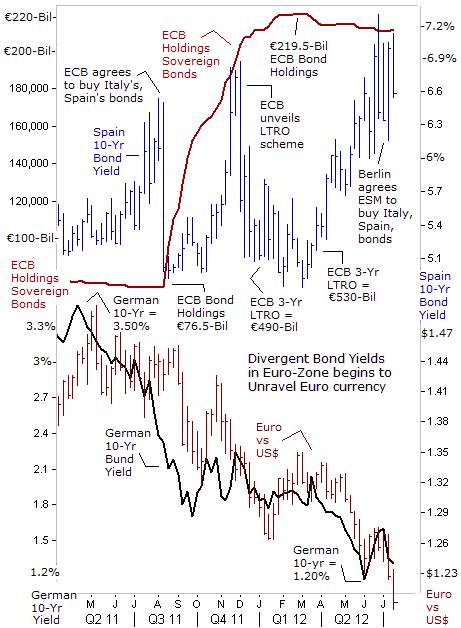
Predicting the future value of the Euro has taken on added complexities for both computer cowboys and traditional commodity traders. Key variables that effect the Euro’s value include the interest rate differential between the yields on Germany’s and Spain’s 10-year bonds. Over the past 14-months, the yield on Germany’s 10-year Bund has declined by -200-basis points (bps) to 1.30%, while at the same time, Spain’s 10-year yield has moved in the opposite direction, climbing +160-bps higher to 5.60% today. A wider spread is a worrisome sign that Spain might default on its debts, and could signal capital flight from the Euro currency.
For the past 17-weeks, the ECB has refrained from purchasing risky sovereign bonds under its Securities Markets Program. Instead, the ECB’s holding of sovereign bonds has actually declined to €210.5-billion last week, down from €219.5-billion in late-February. Since the ECB puts the brakes on its bond buying program in February, the yield on Spain’s 10-year note has spiraled 2% higher to as high as the 7% level. In turn, selling pressure intensified upon the Euro. That’s convinced many analysts that the only way to rescue the Euro from disintegration would be a new charter, allowing the ECB to monetize trillions of Euros worth of sovereign debt. That option is strongly opposed by Germany’s Bundesbank, the ECB’s biggest stakeholder. Furthermore, under that scenario, the unbridled monetization of debts would sink the Euro’s exchange rate against other currencies, which is what traders are betting on.
The latest EU political accord arranged on June 30th, has designated the ECB as the buying agent for bonds purchased by the ESM bailout fund that could act as a “debt shield” for troubled Italy and Spain. The ESM has €500-billion of ammunition, but €100-billion of that is already earmarked for Spanish banks. Ominously, its remaining cash could dry-up very quickly in the event of a panic in Italy’s €2-trillion bond market. Given these realities, the ESM funds could initially be used to put a ceiling over Spanish government bond yields, at say 7%, and capping Italy’s 10-year bond yield at the 6% area. That’s quite a different strategy than trying to force Spain’s borrowing costs lower. During this process, the risk of holding toxic Italian and Spanish bonds would be transferred to the taxpayers in Germany, Netherlands, Finland, and Luxembourg who are already on the hook for €700-billion in bailouts for the their delinquent debtor neighbors, as crony politicians clandestinely bailout the Oligarchic banks.
Capital Flight From Euro, By cutting its repo lending rate 25-bps to a record low 0.75% on July 5th, the ECB has almost exhausted its normal ammunition. The ECB could whittle the repo rate further to 0.25%. The ECB could also boost its long-term liquidity offer. In December and February it injected over €1-trillion into the coffers of the banking Oligarchs with 3-year loans, or LTRO’s. ECB chief Mario Draghi has poured cold water on a third option - allowing the ESM rescue fund to borrow from the ECB, which would dramatically boost its firepower and allow it to drive bond yields lower. However, Euro-zone bankers are hoarding the ECB’s cash injections, and aren’t lending Euros into the real economy and private sector. As a result, the Euro-zone’s economy is suffering from a severe credit crunch, that’s creating further hardships for small businesses, and lifted youth unemployment to an average 22%.
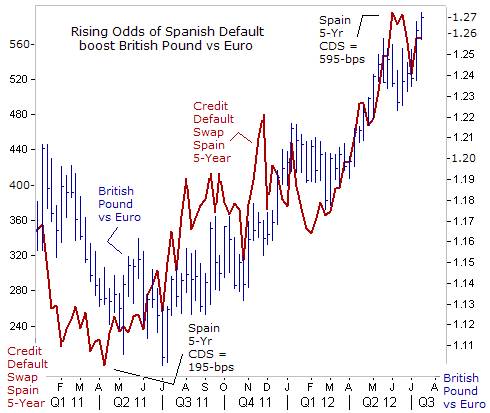
At the end of the day, global investors are worried that the Euro currency experiment would break apart someday, as the wealthier nations grow tired of bailing out their delinquent neighbors. Global investors are switching out of Euros and shifting monies into British pounds, (among other currencies). Sterling rose to a 3-½ year high against the Euro on July 10th, and is tracking the upward spiral in credit default swap rates for Spain’s debt, due to doubts about the insufficient size of the ESM’s bailout funds to fully backstop the combined €3-trillion of debt outstanding in the Italian and Spanish bond markets.
Shanghai Red-chips Slide to 3-year Low, Points to “Hard Landing,” There are many moving parts in the world markets, for traders in commodities to analyze and evaluate, before pulling the trigger on a trade. Dismal economic data from China and India are signaling a further weakening of the global economy, and undermining hopes the dynamic Emerging economies of Asia can prop-up demand for industrial commodities, at a time when European economies are stuck in a recession, and US-economic growth is stalling out.
China’s economy appears to be weakening more rapidly than official statistics would suggest, raising fears of a hard landing that could be felt around the globe. Second-quarter statistics are due to be released on July 13th, and expected to show the Chinese economy slowed to a +7.5% annualized rate, compared to +8.1% in Q’1. That would be the slowest pace since the depths of the global financial crisis. But government data are widely believed to understate the extent of China’s woes. On July 8th, Premier Wen Jiabao warned of “huge downward pressures” on the world’s #2 economy, - one of the strongest admissions yet that China’s top leaders are worried about the rippling effects of the Euro-zone’s recession.
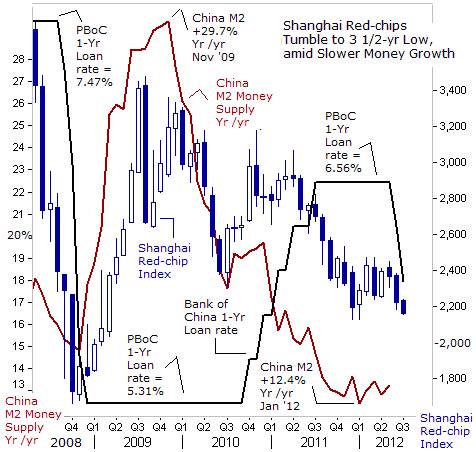
The deceleration in China’s economy, and the brutal Bear market in the Shanghai red-chip index, now 3-years old, follows a year long tightening campaign, in which the People’s Bank of China (PBoC) drained 4.4-trillion yuan, ($700-billion) out of the Shanghai money markets, and hiked its 1-year lending rate +124-bps to 6.56%, to combat a dangerously high rate of inflation. In turn, the tightening of liquidity, slowed the growth of China’s M2 money supply to +12.4% annualized, from as fast as +29.7% in Nov ‘10. Draining liquidity and hiking interest rates reinforced the bearish market trend in the Shanghai red-chip index, - telegraphing an early warning signal to commodity traders of a slowdown in China’s economy.
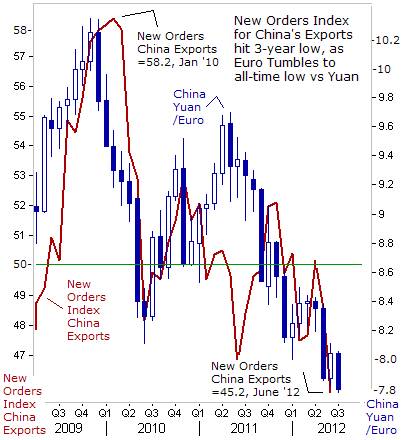
The Shanghai red-chip index closed at 2,164 on July 10th, a 3-year low, as June’s export data pointed to more signs of slowing demand abroad. China’s Purchasing Manager’s sub-index for new export orders, fell to a reading of 45.2 in June, falling further below the 50-mark, signaling a deepening contraction for exports in the months ahead. Most worrisome of Beijing, the Euro continues to lose ground to the Chinese yuan, losing as much as -24% from its peak value three years ago, and Europe buys about one-third of China’s exports. Since the Euro buys fewer Chinese yuan, European consumers could buy fewer Chinese made goods.
Beijing has loosened its monetary policy in recent weeks, in a bid to stabilize the world’s second-biggest economy. The People’s Bank of China (PBoC) on May 13th reduced the amount of depositors’ monies that banks must hold at the central bank to 20%, and in effect injected about 400-billion yuan ($63-billion) into the Shanghai money market. The 50-basis point cut to 20% in banks’ reserve requirement ratio (RRR) was the third such cut in six months.
The PBoC cut its key lending rate on July 5th for a second time in one month in a new effort to reverse its deepest economic slump since the 2008 global crisis. The PBoC lowered the rate on its 1-year loan -31-basis points to 6-percent. It said banks will be allowed to offer discounts to borrowers of up to 30% below that benchmark, an increase from the 20% discount previously allowed. Although lowering the RRR provides banks with more yuan available for lending to borrowers, it’s not likely the extra liquidity can offset the negative effect of slackening exports to Europe and a weakening US-economy, - China’s biggest markets for factory goods.
Beijing must proceed carefully with its easing campaign. China is still suffering the fallout from the last round of state intervention following the 2008 global crisis. To keep the economy humming, Beijing spent $400-billion on public works projects and encouraged banks to lend — easy credit that fueled a housing bubble and a surge of borrowing by local governments. The real estate sector is now deflating, in part because of government restrictions introduced two years ago to clamp down on speculators. Home prices throughout China have plummeted and developers have been saddled with tens of thousands of unsold units.
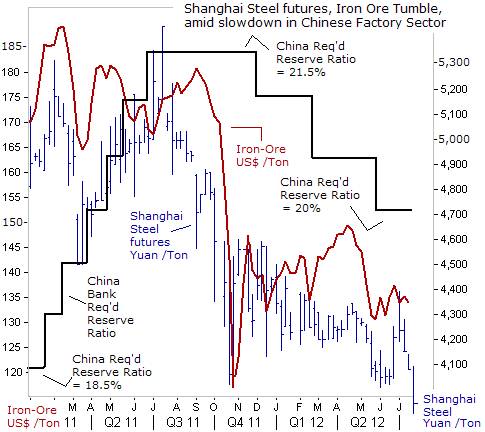
Demand for Steel and Iron Ore in China is taking a hit along with the overall economy. The most-actively traded steel rebar contract for January delivery on the Shanghai Futures Exchange fell as low as 3,906 yuan ($610) per ton this week. Australian miner Rio Tinto is offering its .5% grade Australian Pilbara iron ore fines at $137 a ton via the platform run by the China Mining Exchange, down sharply from around $175 /ton a year ago. China, which buys around 60% of the world’s iron ore, bought -9% less of the raw material in June than May, the fourth month-on-month decline in imports this year. Chinese steel mills are now purchasing more iron ore from stockpiles sitting at ports which are cheaper than fresh cargoes amid fears that steel demand won’t pick up, due to slumping construction activity.
Latin America’s Biggest Economy, - Brazil has already seen its export sales of iron ore, ethanol, cocoa, sugar, and other commodities begin to slump. The recession in Europe and a sharp slowdown in top commodity-consumer China has already resulted in a big shrinkage in Brazil’s trade surplus, cut in half to $7.1-billion in the first six month of 2012, compared with a year ago, and marking the weakest surplus for that period in a decade. Brazil posted a trade surplus of $807-million in June, down from $2.95-billion in May and far below the $4.43 billion surplus in June of last year, - the smallest monthly trade surplus for June since 2002.
Brazil’s economy, - the world’s sixth-largest economy has decelerated significantly over the past 1-½ years. It grew a stellar +7.5% in 2010, its fastest pace in over two decades, but slowed sharply to +2.7% last year as the Bank of Brazil lifted its overnight Selic rate to 12.5%, in order combat an overheating inflation rate. Brazil’s economy has been stagnant during the first half of 2012, and is showing signs of slipping into a outright recession. Brazil’s industrial output fell for a third straight month in May, falling -0.9%, and output was -4.3% lower than a year earlier, the largest annual decline since a -7.6% drop in Sept 2009.
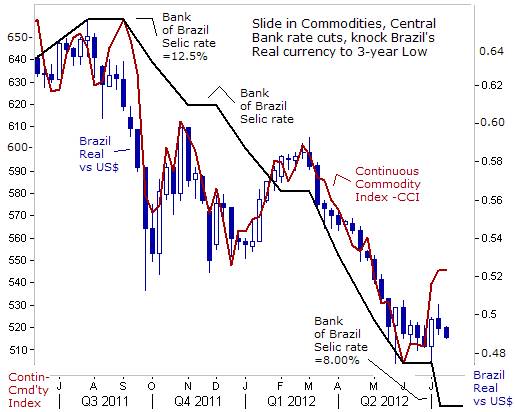
Brazil’s factory sector continued to slump in June. The purchasing managers' index (PMI) for Brazil’s factory sector dropped to an eight-month low of 48.5 from 49.3 in May. Brazilian retail sales fell -0.8%in May, as Brazilians struggle with rising defaults, which are rising to an all-time high, and in turn, has prompted local banks to tighten lending. In an effort to stabilize the economy, the Bank of Brazil slashed its Selic rate 50-bps to a record low of 8% on July 11th, amid a barrage of other stimulus measures. So far, a deluge of interest rate cuts, tax breaks, and tens of billions of Brazil reals in subsidized loans, and targeted state spending, hasn’t enabled Brazil’s economy to regain its lost mojo.
It’s an ominous sign that Latin America’s largest economy is no longer an engine of growth for the world economy. As such, currency traders have dumped Brazil’s real, knocking it to around 49-US-cents this week, compared with 64.5-US-cents a year ago. The Real is a victim of the year long slide in commodities, which account for half of Brazil’s total exports. Brazil’s exports fell to $19.35-billion in June, or 18% lower than a year earlier.
US-Economy on Brink of “Double-dip” Recession, The troubles afflicting the economies of the Euro-zone, China, and Brazil have reached the shores of the United States. The latest reading Purchasing Manager’s Index (PMI) report is saying the US-industrial sector’s engines have gone into reverse. The factory PMI fell below the 50-level in June for the first time since the Great Recession officially ended in June 2009, and is the most visible sign yet that the US is catching the flu that’s already afflicting the rest of the world economy. US-manufacturers have “tapped on the brakes” and are not sure what lies ahead.
The drop of 12.3-points in the PMI’s New Orders Index is the largest since October 2001 (when, in the wake of 9/11, the index dropped 12.4-points) and the second largest decline since December 1980. Thus we are dealing with an event that occurs once in 100 reports. The question is whether this plunge in new orders, reflecting fears over Europe and China (the export order index fell 6-points), will bounce back (as the orders index did in November 2001) or rather, is it a slide into the abyss of a double-dip recession?
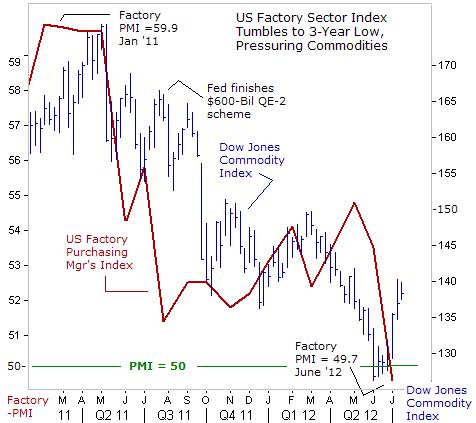
The synchronized slowdown in the Asian, European, and US-factory sectors has taken a toll on the Dow Jones Commodity Index, over the past 14-months. A surge in Chicago grain markets, in corn, soybeans, and wheat, due to a crippling drought in the Midwest farm region, has lifted the index in recent weeks. However, industrial base metals, crude oil, gasoline, and silver prices remain weak. Commodity and precious metal Bulls are desperately praying for the arrival of the “Bernanke Put,” – or a massive blast of fresh US-dollar liquidity provided by the Fed, which can weaken the US-dollar’s exchange rate, and give a lift to commodity markets.
So far, the Fed has frustrated the commodity and US-stock market Bulls, and Gold Bugs, by refraining for launching QE-3. Perhaps, the Fed aims to stay politically neutral ahead of the Nov 6th elections, and prefers to sit on the sidelines, in order to avoid accusations from the Republican Party that its interfering with the outcome of all-important elections. By launching QE-3, the Fed could artificially inflate the value of the US-stock market, and deceive the gullible American public with the illusion of an economic recovery on the horizon. Still, in the opinion of the Global Money Trends newsletter, the Fed would continue to disappoint the QE-3 addicts, and stay politically neutral, until after the Nov 6th elections.
This article is just the Tip of the Iceberg of what’s available in the Global Money Trends newsletter. Subscribe to the Global Money Trends newsletter, for insightful analysis and predictions of (1) top stock markets around the world, (2) Commodities such as crude oil, copper, gold, silver, and grains, (3) Foreign currencies (4) Libor interest rates and global bond markets (5) Central banker "Jawboning" and Intervention techniques that move markets.
By Gary Dorsch,
Editor, Global Money Trends newsletter
http://www.sirchartsalot.com
GMT filters important news and information into (1) bullet-point, easy to understand analysis, (2) featuring "Inter-Market Technical Analysis" that visually displays the dynamic inter-relationships between foreign currencies, commodities, interest rates and the stock markets from a dozen key countries around the world. Also included are (3) charts of key economic statistics of foreign countries that move markets.
Subscribers can also listen to bi-weekly Audio Broadcasts, with the latest news on global markets, and view our updated model portfolio 2008. To order a subscription to Global Money Trends, click on the hyperlink below, http://www.sirchartsalot.com/newsletters.php or call toll free to order, Sunday thru Thursday, 8 am to 9 pm EST, and on Friday 8 am to 5 pm, at 866-553-1007. Outside the call 561-367-1007.
Mr Dorsch worked on the trading floor of the Chicago Mercantile Exchange for nine years as the chief Financial Futures Analyst for three clearing firms, Oppenheimer Rouse Futures Inc, GH Miller and Company, and a commodity fund at the LNS Financial Group.
As a transactional broker for Charles Schwab's Global Investment Services department, Mr Dorsch handled thousands of customer trades in 45 stock exchanges around the world, including Australia, Canada, Japan, Hong Kong, the Euro zone, London, Toronto, South Africa, Mexico, and New Zealand, and Canadian oil trusts, ADR's and Exchange Traded Funds.
He wrote a weekly newsletter from 2000 thru September 2005 called, "Foreign Currency Trends" for Charles Schwab's Global Investment department, featuring inter-market technical analysis, to understand the dynamic inter-relationships between the foreign exchange, global bond and stock markets, and key industrial commodities.
Copyright © 2005-2012 SirChartsAlot, Inc. All rights reserved.
Disclaimer: SirChartsAlot.com's analysis and insights are based upon data gathered by it from various sources believed to be reliable, complete and accurate. However, no guarantee is made by SirChartsAlot.com as to the reliability, completeness and accuracy of the data so analyzed. SirChartsAlot.com is in the business of gathering information, analyzing it and disseminating the analysis for informational and educational purposes only. SirChartsAlot.com attempts to analyze trends, not make recommendations. All statements and expressions are the opinion of SirChartsAlot.com and are not meant to be investment advice or solicitation or recommendation to establish market positions. Our opinions are subject to change without notice. SirChartsAlot.com strongly advises readers to conduct thorough research relevant to decisions and verify facts from various independent sources.
Gary Dorsch Archive |
© 2005-2022 http://www.MarketOracle.co.uk - The Market Oracle is a FREE Daily Financial Markets Analysis & Forecasting online publication.


