


GOLD Deja Vous?
Commodities / Gold and Silver 2012 Jul 09, 2012 - 03:45 PM GMTBy: Tony_Caldaro

 Thanks to the FED’s recent addition of the London PM fix data, April 1968 to date, we have uncovered an unmistakeable repetitive pattern in Gold. The chart below displays the price data for the entire period.
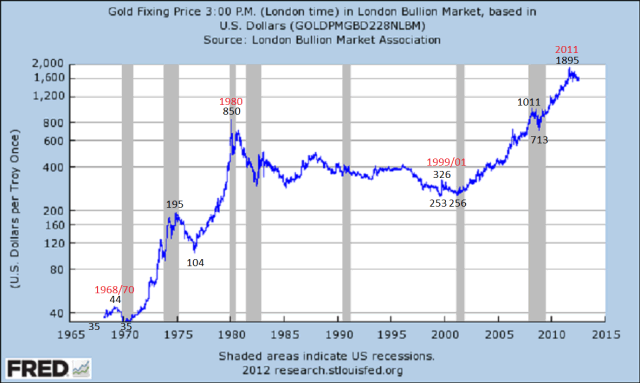
First a little history. After World War II the Brenton Woods system was established whereby all currencies were valued in terms of USDs, and the USD was on a Gold standard priced at $35/oz. This made all currencies indirectly linked to the Gold standard. Heading into 1968 the USA started to have a difficult time maintaining the price of Gold at $35/oz. In March 1968, the USA abandoned its Gold intervention policy and allowed it to trade freely in the secondary market. The data in the above chart begins the following month.
The initial reaction to this two tier Gold pricing system was a rally to $44 by 1969. Then Gold declined back down to $35 by 1970. In January, 1970 the Gold price began to rise again. By August, 1971 the price of Gold had risen back to $44, and the USA abandoned the Gold standard altogether. This launched the 1970-1980 bull market. Notice the 1968-1970 double bottom, then the 10 year 1970-1980 bull market.
After the January, 1980 blowoff top in Gold a 19 year bear market followed. In 1999 the price of Gold hit its low at $253. Then after a rally to $326 it retested that low again in 2001. What followed, as we have all observed, was a 10 year bull market into the 2011 high. Notice this bull market pattern, in time, is identical to the previous bull market: a 2 year double bottom followed by a 10 year bull market.
The major difference between the two bull markets is obviously price. During the 12 year (1968-1980) bull market cycle the price of Gold rose from $35 to $850 using the London PM fix data. Prior to this bull market there were decades of pented up demand. In fact, US citizens were not allowed to directly own Gold until late 1974. The 1970′s was also a period of high inflation, directly devaluing the purchasing power of all currencies. Gold, considered a safe haven against currency devaluation and now legal to own, soared. The last stage of the bull market was quite spectacular.
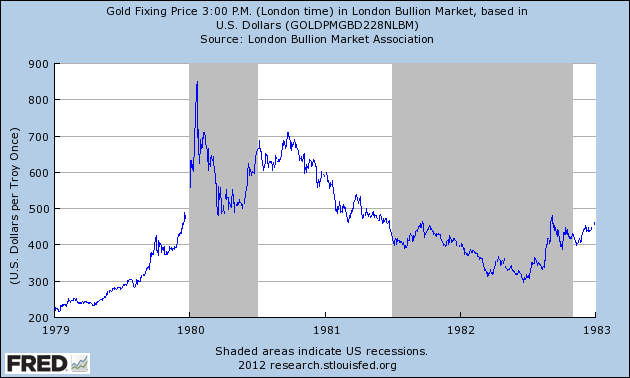
Notice during the last year of that bull market Gold soared from just above $200 to $850. Also notice the nearly $100 gap up over the holidays in late 1979 into the blowoff top in January, 1980. Gold had gone parabolic to end that bull market. When parabolic tops end, as we all can remember from the dotcom bubble, the collapse in percentage terms is just as sudden. But putting that aside look at the decline in actual USD’s.
The initial drop from $850, about $350, retraced about 50% of the bull market’s last year advance. Then a failed rally attempt to reestablish the bull market, about $200, retraced about 2/3′s of that decline. After that the bear market took hold and prices gradually declined to around $300 by 1982. Now let’s review the current price activity in the Gold market.
During this bull market we at first had a demand driven commodity boom, 2001-2008, as emerging market countries grew putting a strain on supply. Gold rose to just over $1000 during this phase. When the commodity boom ended all commodity prices collapsed, as the deflationary impact of this Secular cycle took hold. Keep in mind Gold only experiences real bull markets during Secular cycles.
During the collapse in late 2008 Central Banks started what is termed Quantitative Easing programs. They essentially were increasing the money supply at a rapid rate to offset the deflationary pressures. Gold, considered a safe haven against currency devaluation, rallied. The second QE program in the US, QE 2, ended in June, 2011. Gold corrected then rallied again on speculation of a QE 3 program. When the FED announced Operation Twist in mid-September 2011 Gold had topped and was already correcting.
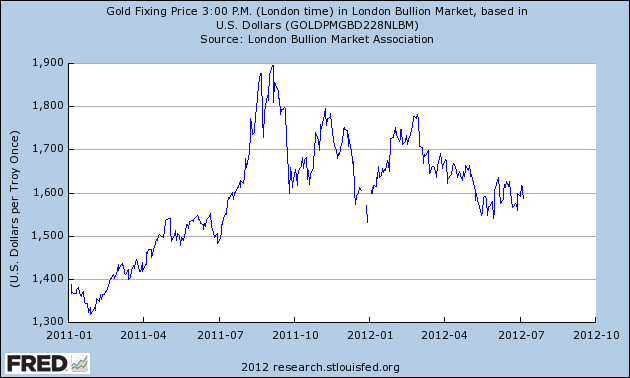
Notice the initial drop from $1895, about $350, retraced about 50% of the 2011 advance. Then a rally attempt to reestablish the bull market, about $250, retraced about 2/3′s of that decline. Now Gold has been gradually declining towards those lows again. Just like it did in 1981, the year after the 1980 bull market high.
One would have to admit the similiarities between both bull markets are quite striking. Despite the difference between the inflationary pressures of the 1970′s, and the deflationary pressures of the 2000′s. Now, even the decline after their respective peaks are also looking similar. When one takes into account that most of the commodities peaked in price during the 2008-2011 time period. And, now appear to be in ongoing bears markets. We will have to consider that Gold is currently in a bear market, unless it can exceed its 2011 high to extend it. Gold charts, in Comex terms, are provided in the following link: http://stockcharts.com/public/1269446/tenpp/9. The FED’s London PM fix data: http://research.stlouisfed.org/fred2/series/GOLDPMGBD228NLBM.
CHARTS: http://stockcharts.com/...
http://caldaroew.spaces.live.com
After about 40 years of investing in the markets one learns that the markets are constantly changing, not only in price, but in what drives the markets. In the 1960s, the Nifty Fifty were the leaders of the stock market. In the 1970s, stock selection using Technical Analysis was important, as the market stayed with a trading range for the entire decade. In the 1980s, the market finally broke out of it doldrums, as the DOW broke through 1100 in 1982, and launched the greatest bull market on record.
Sharing is an important aspect of a life. Over 100 people have joined our group, from all walks of life, covering twenty three countries across the globe. It's been the most fun I have ever had in the market. Sharing uncommon knowledge, with investors. In hope of aiding them in finding their financial independence.
Copyright © 2012 Tony Caldaro - All Rights Reserved Disclaimer: The above is a matter of opinion provided for general information purposes only and is not intended as investment advice. Information and analysis above are derived from sources and utilising methods believed to be reliable, but we cannot accept responsibility for any losses you may incur as a result of this analysis. Individuals should consult with their personal financial advisors.
© 2005-2022 http://www.MarketOracle.co.uk - The Market Oracle is a FREE Daily Financial Markets Analysis & Forecasting online publication.
Comments
|
Buruni
09 Jul 12, 16:18 |
Typo
Sir, In French language "deja vous" translates to "You already". Maybe you meant "Deja vu" for "Seen already; seen before". |