


Stocks Bear Market Focus Point: Yet again, Another Bull Trap in the Making
Stock-Markets / Stocks Bear Market Jul 09, 2012 - 03:09 PM GMTBy: Garry_Abeshouse

 The extraordinary end of month move up in the prices of currencies, oil, gold, copper and equities on June 29th, should be a warning to all of the financial markets’ propensity for large and highly volatile short term moves. Moves facilitated by hedge funds using similar trading tools all making similar trading decisions at the same time. In this case it appeared to be initiated by rather intense end of quarter short covering exacerbated by a rather over-hyped prop-up style financial agreement in Euroland. Timing of this agreement just could not have been better, with very little media coverage at the time pointing out the insignificance of the amounts of money involved in bank support agreements, compared to the trillions of dollars at risk associated with a deteriorating world economy. My earlier discussion on end of month trading shenanigans by the hedge funds in my last commentary on June 4th, was certainly well timed.
This week the die has been set for the next move down, as yet again another Bull Trap forms. It’s absolutely amazing how easy it appears to be to create bullish rallies from weak scenarios, as bankers and hedge funds take a well-earned five day holiday away from the day to day scheming against their clientele, to quietly settle down and be entertained by the ridiculous goings on of the US Republican party over the extra-long week end. And as the economic world continues its slow burn into exposing an ever expanding web of corporate and government corruption, we are beginning to see a glimpse of what the future bonfire of vanities holds – and it’s not a pretty sight.
I continue to be unsurprised how some of the most insightful commentary now comes from the likes of Robert Reich’s blog, Matt Taibbi from the Rolling Stone magazine, Zero Hedge blog, Caixin Online and of course Garry Trudeau’s Doonesbury cartoons (see last week’s take on Mitt Romney) rather than the mainstream media. I expect history will not be too kind to the latter’s interpretation of current events over the coming years.
With all this in mind, together with the rather soft positioning of last week’s rally and the market’s lack of follow through to date, it suggests that even if we have not yet seen the short term top, it will not be too far away. At the same time, looking for bottoms is fast becoming a favourite pastime again, as can be judged from the low $VIX value and the distinct lack of interest in the ultra-short ETFs such as SDS. This all suggests that what has happened over the last six or so years, has not yet registered in the psyche of the financial world and that post-autistic economics, has yet to play a meaningful role in the way the world economy is run – but I live in hope.
Meanwhile as Euroland implodes, the USD and US treasuries are talked down and as other world currencies trade their way through long standing chart patterns suggesting future moves south, confusion and restrained panic reigns. Vagueness and double-speak saturate the media and ever stronger efforts are made to try and hide the real state of affairs – both George Orwell and Marshall McLuhan would feel well justified in their views had they been alive today.
One of the most interesting currencies to watch, as I mentioned last time, is going to be the Chinese Renminbi/Yuan, as the Chinese will certainly do their best to make sure their currency stays weak against the USD in order to protect their economy against the world economic slowdown. A consequence that needs to be watched here though is that on the first sign of real weakness in the Chinese Renminbi/Yuan against the dollar, we shall probably see a huge increase, in what probably is already a large outpouring of cash from the Chinese mainland into safer havens. After all, the Young Political Princelings have to preserve their billions somehow and they know from history, that when the writing is on the Great Wall of China, it is time to get out - if they can.
Charts in a Nutshell
Technical Analysis using charts, endeavours to graphically illustrate the historical narrative associated with financial markets, allowing for subjective interpretations on the way prices in these markets move.
Charts are used less to answer why and more to answer how prices move in financial markets. The very ambiguities associated with predicting these price moves, are made even more complex by difficulties in disassociating the human narrative from imperfect statistical expressions of these markets. But in the end all we can expect, is to make do with the best from what we have. This implies reliance on groups of charts rather than any one individual chart such as the Dow 30 or the S&P 500, as this makes for more prudent analysis.
I believe in the KISS principle of trying to keep the charts I use simple and uncluttered, as well as avoiding many of the derivative style momentum indicators as much as possible. Trendlines by definition will always have ambiguities attached to where they are drawn – and that is a good rather than a bad thing, as it allows the lateral thinker to observe charts from multiple perspectives.
Weekly Charts
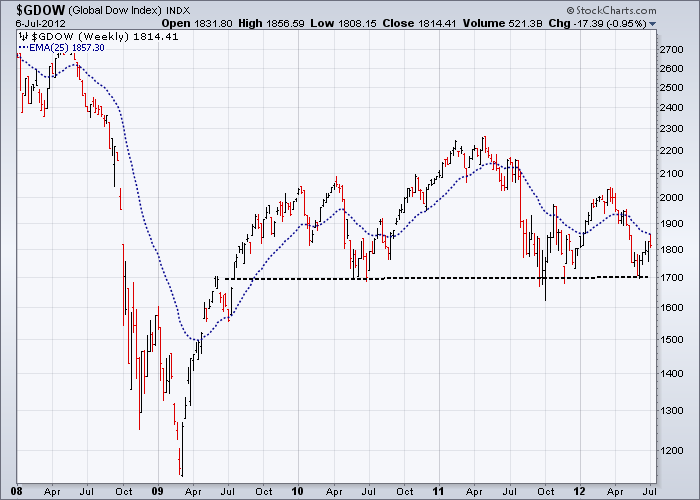
$GDOW: The weekly chart on the equal weighted Global Dow 150 Leaders Index below clearly shows how quickly the equity rally ran out of steam in the aftermath of the 2008 financial crisis. The export of jobs to SE Asia over the last 30 to 40 years has clearly taken its toll on western economies and is a major factor of why this chart is showing a major three year Head & Shoulders top at this time. Only a very small fall in equities will be required for prices to fall below the neckline at 1700, confirming a probable testing of the 2009 lows.
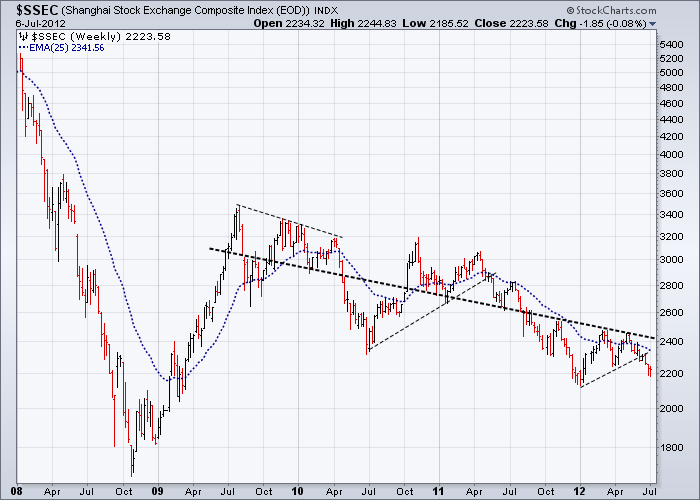
$SSEC: The continuing slowdown in western economies will only exacerbate internal negative financial issues occurring within China, underlying the weaknesses shown in the $SSEC index. The inability of the index to break through and stay above the down sloping three year median line, despite the extensive iPod/iPad rally in equities since last August on the NYSE, only underlines the potential for further falls over the medium term. It also probably underlines how most of the profits went to Apple rather than those companies involved in manufacturing product.
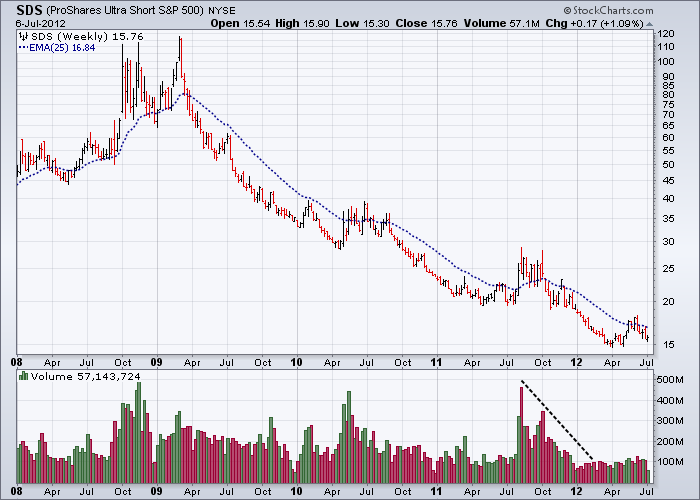
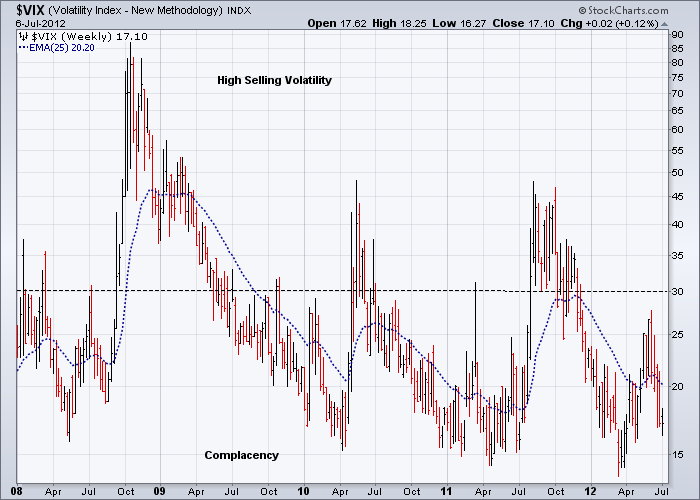
SDS, $VIX: On the NYSE, SDS is the highest traded ultra-short ETF covering a major equity index, in this case the S&P500, and together with the chart on the $VIX, highlights the current complacency in equities at this critical point in time.
In my last commentary in June, I observed there was a high probability that the major market players had made a decision to begin selling down equities from at least early February. Current observations bring me to the conclusion that the financial community is now deeply divided on where an eventual bottom may lie, with one group extremely bearish and more or less agreeing with much of what I have been saying for some time now and those who are more optimistic and who think that the bottom may not be far away. This view is underlined by last week's Wall Street Sentiment Survey results (June 29 cut off) showing a certain growth in optimism, with 80% bulls versus 20% bears.
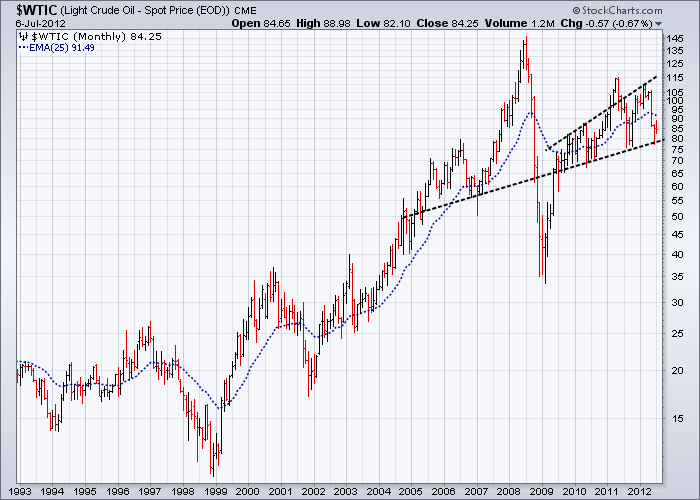
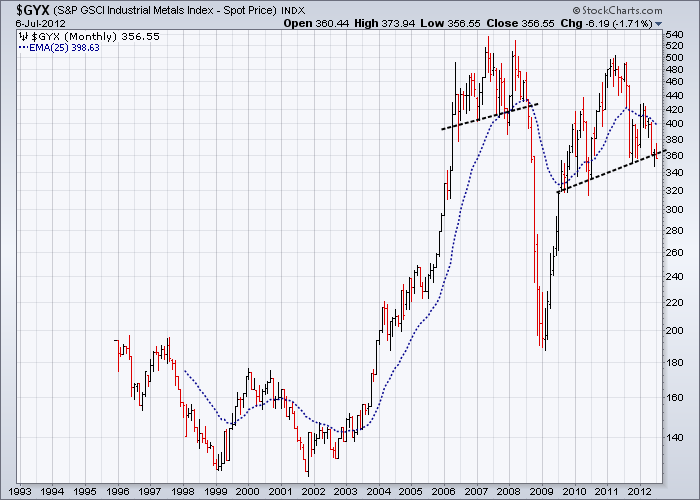
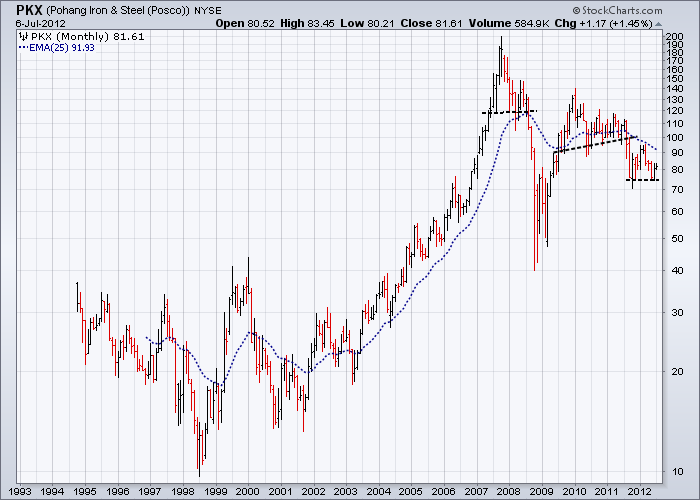
Monthly Charts
$WTIC, $GYX, PKX: These three charts are strongly linked to demand in oil, industrial metal prices and steel and all three, like the $GDOW Index are sitting precariously just above crucial support lines. There does not need to be much of a fall for the ensuing loud thud to be heard around the world. In this scenario, like the $GDOW, a testing of the 2009 low would probably be on the cards.
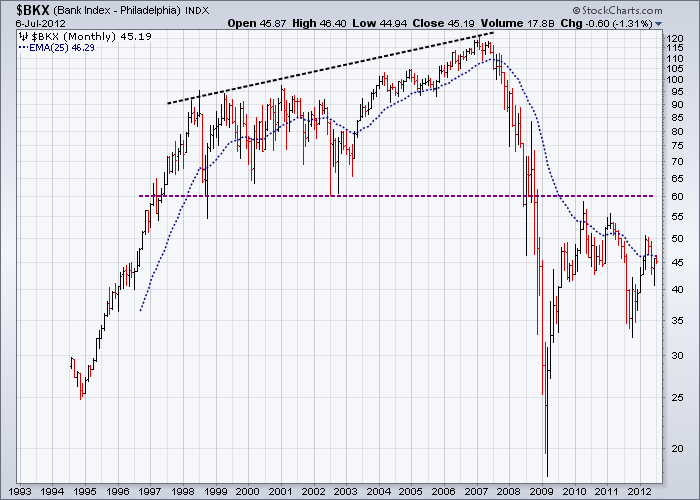
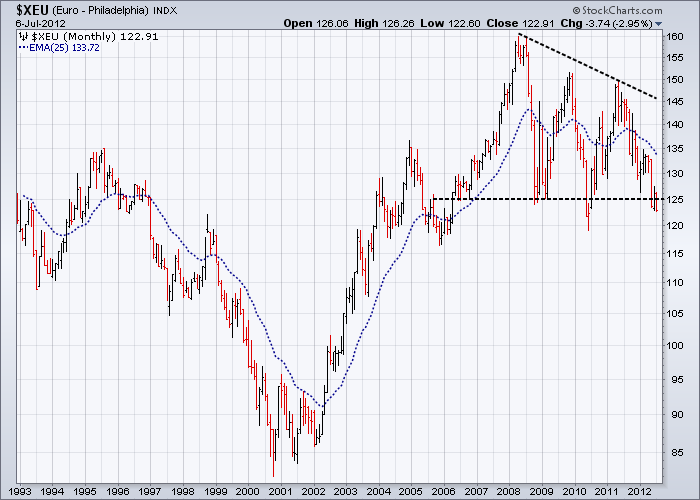
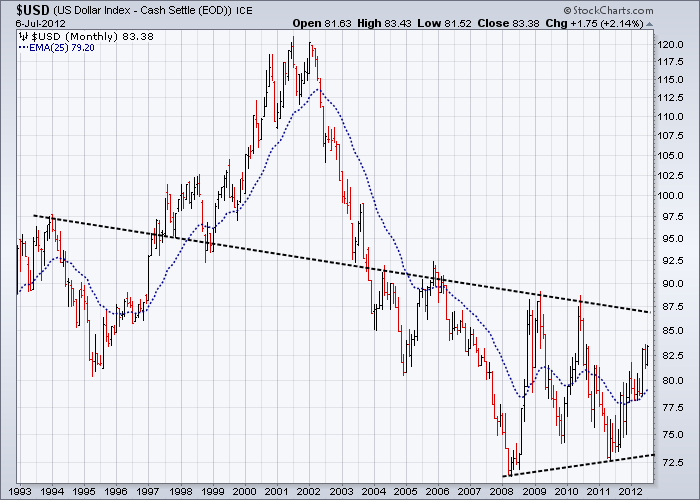
$BKX, $XEU, $USD, $USB: The banking index I have shown before many times and I show it again to highlight the extremely low possibility of much future strength appearing in this sector – which of course should come as no surprise. The Euro is currently sitting within a major support zone between 1.200 and 1.250. Any fall below 1.200 would probably coincide with associated strength in the USD, which I have mentioned before is probably sitting in the latter part of a substantial base. The EURO and most other currencies on the other hand are in tops.
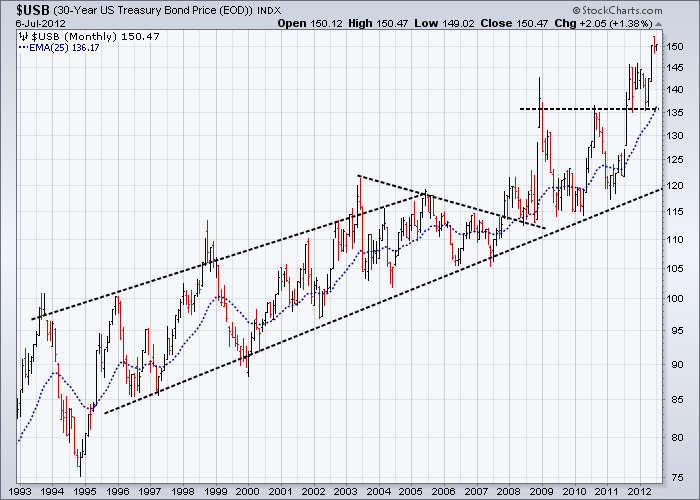
As a corollary to this, the trend lines I have drawn on the US 30yr T-Bond chart point to potentially one of the most bullish charts I have ever scene – reminding me a lot of charts from the early stage of the Australian mining boom of the 1960’s and 1970’s. And I do stress the word potentially.
So not surprisingly in recap, the USD continues to build what still appears to be a very large base, suggesting a future pointing strongly northward, contrary to much of the discussion in the media. This scenario paints an uncertain future paved with political and economic dysfunction, high levels of social unrest and the inevitable unravelling of “some” of the economic parasitism that has consumed much the world over the last 30 years or so.
But as I have said before, big money must go somewhere in the interim, which means the strongest of the weak shall be king – and for the foreseeable future this still means the USD, a factor that underlines the base building alluded to above. In this scenario though, and where the real complexities will lie, is how the currency cross-rates will perform together with gold’s performance against currencies other than the USD. On a side note to this, as discussed above, the continuing strength of US treasuries, despite the rise in equities over the last four weeks, should not be ignored.
A Final Word
Few of us can easily surrender our belief that society must somehow make sense. The thought that the state has lost its mind and is punishing so many innocent people is intolerable. And so the evidence has to be internally denied. - Arthur Miller, 1996
We live in a world where for too long, trust has been devalued by slavishly placing the value of profits over the welfare of people’s lives and by religious, political and corporate leaders replacing instructive communication with deceptive marketing and spin. New daily revelations on alleged corruption in financial circles, have now been openly compared to that of the mafia. Scientific research into health and medicine is a good example of how new knowledge that should be focussed into bettering the human condition, has instead been geared so much to the marketing of new product, that the whole concept of what constitutes human health has been severely compromised in many areas.
Perhaps it may seem to you, the reader, that what is written on this page is simply the ravings of yet another lunatic blogger. But what you may not realise, is that all these issues I am discussing here, are what constitutes fairly normal behaviours of the major players that cause these major market tops to form in the first place. Market tops are more than just chart patterns, more than just words on a page, more than just the results of corporate corruption and greed and more than just the excesses of consumption by you and me. They are much more than that.
These tops are the direct result of what happens when the rules of law applied to you and me are not applied to those controlling the worldwide networks of finance and commerce. This simple failure to apply the rule of law to these entities has allowed the banking and corporate monoliths to rip off whoever they want, whenever they want over a long period of time. The writings of Naomi Klein and Matt Taibbi have been devastating in exposing many of their rip offs, scams and crimes.
There is also a whole world of complementary issues out there, that make up the excesses of humankind’s insatiable desires, as Bertrand Russell was want to say. The same actions produced by these insatiable desires both instigate bull markets and cause them to end with a huge thud – a thud that inevitably affects us all. And as a direct consequence of getting rid of some these thud forming rats that are bankrupting our institutions, corrupting our dreams and destroying our trust - is that at some future time, the piper must be paid. And this is really what bear markets are all about – paying the piper.
Till next time.
Garry Abeshouse Technical Analyst. Sydney Australia
I have been practicing Technical Analysis since 1969, learning the hard way during the Australian Mining Boom. I was Head Chartist with Bain & Co, (now Deutsch Bank) in the mid 1970's and am now working freelance. I am currently writing a series of articles for the international "Your Trading Edge" magazine entitled "Market Cycles and Technical Analysis".
I specialise in medium to long term market strategies.
© Copyright Garry Abeshouse 2012
Disclaimer: The above is a matter of opinion provided for general information purposes only and is not intended as investment advice. Information and analysis above are derived from sources and utilising methods believed to be reliable, but we cannot accept responsibility for any losses you may incur as a result of this analysis. Individuals should consult with their personal financial advisors.
© 2005-2022 http://www.MarketOracle.co.uk - The Market Oracle is a FREE Daily Financial Markets Analysis & Forecasting online publication.