


Crude Oil Price Bubbleomics Impact on EP Valuations
Commodities / Crude Oil Jun 29, 2012 - 03:51 AM GMTBy: Andrew_Butter

 Just so you know, my interest in oil prices is not because I trade (I don’t), or that I care about global warming, tree-hugging, or America’s bill to buy oil, all I care about is the price; because that drives the value of companies and projects I’m involved in.
This is an update on an article posted eighteen months ago called Crude Oil Price Forecast to 2020. The issue then was the specter of Peak Oil.
http://www.marketoracle.co.uk/Article24849.html
The news is that Peak Oil didn’t come to town just yet, at least not according to the 2011 world oil production reported in the latest BP Statistical Review of World Energy.
That’s shown here along with lines for America, Canada, Saudi Arabia and other GCC countries (UAE, Qatar, Kuwait and Oman) on the right hand scale, in 2011 together all those places accounted for 37% of world production.
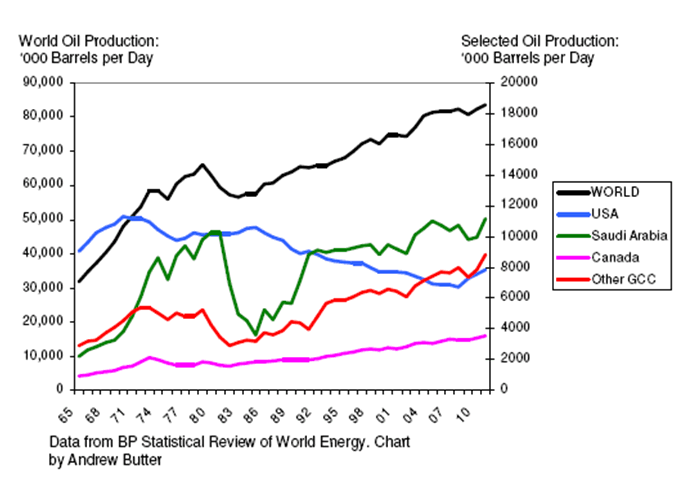
So the peak wasn’t in 2005 like Dr. Campbell predicted or even in 2006 which is what the IEA said last-year. It may turn out to have been in 2011 but we are going to have to work through 2012 to find that out, or even longer, depending mainly on how the European experiment with getting to work on donkeys plays out.
From the chart it looks like Saudi Arabia is not such a big swinger as they were in the 1970’s and 1980’s. Nowadays they and the other GCC states are just milking that cow for all she is worth while the good times roll.
But with oil prices down below the $100 mark (Brent) which the Saudis now say is “fair”, we are going to find out pretty soon whether this time around they will make the “necessary sacrifices” so that all the other oil producers can keep pumping at full capacity to squeeze out the last drops of the good-times, like they did in the 1980’s.
Interestingly two years ago Saudi Arabia said $75 was “fair”. If the jump in their expectations to $100 is not proof that the threat of dreaded hyper-inflation round the corner I don’t know what is…although I guess, if prices go down to $75 that will be proof of the threat of the dreaded deflation…and $60…double horror? The central banks are going to have to be nimble designing their inflation targeting bail-out policies that allegedly create wealth out of thin-air, to address those two contingencies.
The reality is that oil drives the world. And as he pointed out himself, Ben Bernanke does not control the price of oil, nor does the President of The United States of America…who incidentally, Bob Dylan once remarked, sometimes has to stand naked.
But the new player in town is clearly America. Although the extra production is only about a million barrels a day compared to two million extra from the whole GCC, that increase suggests that at anything over $75 it makes economic sense to invest in new techniques like fracking to squeeze more oil out of holes that were previously uneconomical.
The big IF of course is those Canadian oil sands. They were hot in 2008, then they were cold, then they were hot, now they are getting cold.
One suspects that behind the Saudi rhetoric about keeping oil prices fair for the sake of the world economy and world peace…like a modern day fairy-godmother-of-last-resort, there is the thought that if prices stay above $120 or so for long then some serious EP investment is going to get directed into that area, rather like the investment in the North Sea in the 1970’s which kept prices a long way lower than “fair”…until that oil ran out.
In the event the Brits and the Norwegians would have made a lot more money if they had taken that slower. A good part of that investment turned out to have been what the Austrians call mal-investment, which in the widest sense is any investment made in a bubble that comes on line after the bust, whether or not it was credit or cash or pressure from populist governments hungry for election-candy that drove the timeline.
Another way to tell that Peak Oil is probably not an issue…YET…is that prices went down 25% over the past four-months; if they hadn’t that would have signaled that the fundamental value of oil (value not price) was perhaps starting to be dictated not so much by what the customers can afford to pay without suffering unduly (Parasite Economics), but by the cost of getting your hands on new stuff.
That’s the likely cost now and in the future of finding sources of oil that haven’t been found, or going into fields that have been found but not developed because it wasn’t economical…as in the Canadian oil sands. And then developing those sources to the point at which enough new oil can be brought to market to make up the physical (as opposed to political) shortfall; International Valuation Standards calls that Depreciated Replacement Cost.
In that scenario anyone with oil in the ground might be tempted to hold onto it even if it only costs $6 to pump…and then wait until what’s “fair” goes above $150 in say ten-year’s time or until there is another bubble. The alternative is pumping it today, taking the money, and buying 10-Year Treasuries at 1.6% yield, you don’t have to be a financial genius to work out which of those two options plays best.
Two things can happen next, predicated by either (a) oil prices spiking down to $60 which will shake out all of the mal-investments of the past two years…i.e. in oil sands and stockpiles which are currently at a world-record, or (b) those were not mal-investments, in which case peak oil really is happening and prices will not spike down to $60. We live in interesting times!!
The idea of bubbleomics is that in any market there is a “value” defined as fair-intrinsic-fundamental-equilibrium…whatever you want to call it…which International Valuation Standards calls other than market value, and which is normally pretty much the utility value, except of course, when it’s not.
So long as peak oil is not on the table, that value (according to me) is now equal to about 3.8% of the world’s GDP (nominal) divided by the world’s production. Where parasite economics comes into the picture is that’s the price x production = total cost below which the cost of buying oil does not constrain world economic growth.
So in that analogy, the buyers are the “hosts” and the producers are the “parasites”, and as all successful parasites know, if you suck too much blood, your host falls down dead, and then you got nothing. And hey Hussein…calm down!! I’m not calling YOU a parasite, this is an analogy…don’t be so sensitive!
Insofar as the buyers are concerned, the way the world economy works is that you buy oil, then you put that to use, so you add value, and that’s where GDP comes from. I know, you are saying I got that wrong, any half-trained economist knows that GDP is about innovation, team work, free-markets and creating money out of thin air by manufacturing synthetic collateralized debt obligations. OK I agree with all that, but imagine how far that would get you if there wasn’t any oil…riding your donkey?
The parasite economics threshold is the red-line on this chart. According the General Theory of Bubbleomics (http://www.marketoracle.co.uk/Article12114.html) price oscillates around that red line in a predictable way following bubbles; that’s another way of saying “markets overshoot”, what’s new is that it puts precise numbers on that process.
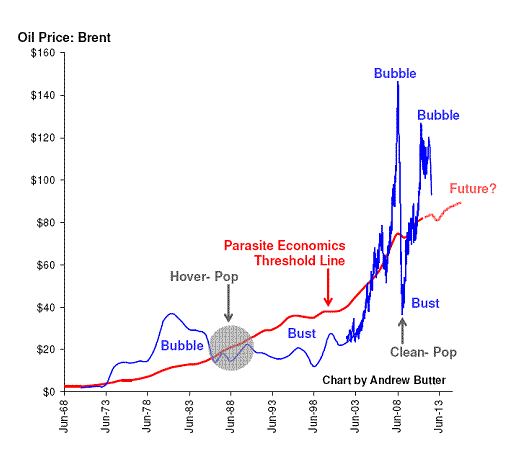
Notice the extent of the bubbles are pretty much reflected in the extent of the busts, both in magnitude and timing, big long bubbles result in big mal-investments that take time to wash clean, short bubbles generally just create excess inventory and it doesn’t take so long for that to be wiped clean.
Also there are two types of pop, some hover around the fundamental line for a while…that happened for the S&P 500 after the Dot.com, some are clean and sharp. The jury is still out as to whether the current oil-bubble pop will be sharp or whether it will hover; or indeed whether there will be a re-set. Proof that peak oil is not on the cards will only happen when oil goes down to $60.
With regard to the dynamics, the “theory” says that the size of the bubble is reflected in the size of the pop because money like water is incompressible. But the pop can be forestalled, for example by central bankers like Alan Greenspan “easing” or by the Saudi’s pumping, but in the end, the inevitability of the pebble in the pond, is immutable.
Why do I think that’s right? Well when oil was $40 that model said it would go to $90, it did, when it hit $125 (Brent) it said that was a bubble and it would pop, it did Milton Friedman once said the once, the test of a theory is can it make predictions that turn out correct, well this one clearly can.
By the way, I’ve re-done that chart slightly since I wrote about this eighteen months ago. The big change is that I cheated, well sort of, basically to line up the nodes on the bubbleomics better. I’m saying that now the magic number is 3.8% up from 3.3% and going up slowly. I imagine that trend will continue and for instance one of these days America might stop subsidizing oil consumption (yes they do), and also that prissy socialist tree-hugging idea of driving a car which does more than ten miles to the gallon will start to get some traction.
So where are the investment opportunities right now?
Well, in a word, buy when there is blood on the streets.
My theory is that if peak oil is not on the cards, then what happens next; or perhaps after a bit of a “hover”, prices will go down into the region of about $60, then they will go back up to about $85 where they will settle at, until perhaps there is another bubble, that process will take one to three years.
And if they don’t that’s Peak Oil emerging so it’s Buy, Buy, Buy and Bye, Bye Miss American Pie.
If you believe my story that oil will go down to $60 you can buy an option to sell oil this time next year at $100 and sit back and wait for the money to roll in. Or, if you like, you can short EP companies or companies that service that sector, or even better, oil sand companies, although on that score, you might have missed the boat:
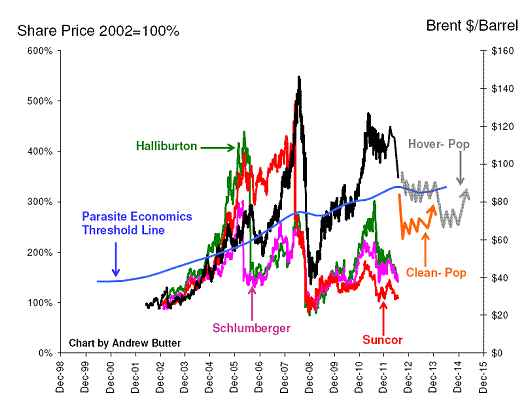
That’s a chart of oil prices compared to the stock prices of three randomly selected oil-field companies.
Halliburton and Schlumberger make money out of figuring how to make sure your holes don’t blow up and then they open up the geology (with varying degrees of success – but they get paid day-rates), Suncor are big in Canadian oil sands.
So eyeballing, it looks like there is a correlation of sorts, by the way I put my predictions for the price (if Peak Oil is not an issue), for either a clean-pop or a hover pop. Personally, looking at the structure of what I call the bubble, I’d say a hover-pop is more likely, it all depends on who cuts back production to keep the price up; my instinct is that some will, why sell oil cheap when you can afford to wait?
So looking at that in more detail:
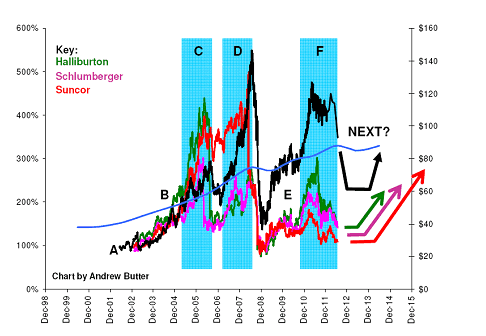
A to B: Everyone followed up the price of oil as it powered through the fundamental line for the first time in twenty years.
C: There was a bit of an overshoot, but the interesting thing is that the service companies stock-prices dropped before that temporary peak, and the little bust. Notice they bottomed six month before oil bottomed (could that be a leading indicator), but the enthusiasm for oil sands powered through that bump in the road.
D: then there was the mega-bubble, the service companies were slow to follow that up, and interestingly everyone “popped” before oil popped and again the bottom in stocks preceded the bottom in oil.
E: The recovery in price back to the fundamental, pulled everyone up, but there was a lag; once bitten-twice-shy?
F: Again the stocks retreated prior to the recent pop in oil prices, the question now is did they bottom, if they did you would expect a “hover-pop”, but eyeballing I’d say that bottom isn’t in quite yet.
Personally, all I’m interested in is convincing some people that the black line “NEXT” is what going to happen over the next two to three years.
There again, now I did that chart and looked at it that way I’m contemplating having a bit of a flutter buying into some oil service companies . If I’m feeling particularly bold, maybe also an oil-sands company, one of these days that’s going to make good economic sense. By the way if you are interested in what a “trained expert” has to say on that there is a very good article on oil-sands companies (slightly mistimed but the analysis is good) here: http://seekingalpha.com/article/250067-how-to-play-the-canadian-oil-sands.
Personally I’d be happier if they bought a load of second-hand nuclear power stations from Japan to provide the energy you need to distill the juice out of that stuff. But the way I read it all those stocks could double in price in two years. Then again, I could be wrong, I’ve been wrong before (more than once).
By Andrew Butter
Twenty years doing market analysis and valuations for investors in the Middle East, USA, and Europe. Ex-Toxic-Asset assembly-line worker; lives in Dubai.
© 2012 Copyright Andrew Butter- All Rights Reserved
Disclaimer: The above is a matter of opinion provided for general information purposes only and is not intended as investment advice. Information and analysis above are derived from sources and utilising methods believed to be reliable, but we cannot accept responsibility for any losses you may incur as a result of this analysis. Individuals should consult with their personal financial advisors.
Andrew Butter Archive |
© 2005-2022 http://www.MarketOracle.co.uk - The Market Oracle is a FREE Daily Financial Markets Analysis & Forecasting online publication.