Oil Price Differentials: Caught Between the Sands and the Pipelines
Commodities / Crude Oil Jun 20, 2012 - 01:04 PM GMTBy: Marin_Katusa
 Marin Katusa, Casey Research writes:
One of oil's most important characteristics is its fungibility, which means that a barrel of refined oil from Texas is equivalent to one from Saudi Arabia or Nigeria or anywhere else in the world. The global oil machine is built upon this premise – tankers take oil wherever it is needed, and one country pays almost the same as the next for this valuable commodity.
Well, that's true aside from two factors that can render this equivalency void. In fact, crude oil prices range a fair bit according to the quality of the crude and the challenge of moving it from wellhead to refinery. Those factors are currently wreaking havoc on oil prices in North America: a range of oil qualities and a raft of infrastructure issues are creating record price differentials. And with no solution in sight, we think those differentials are here to stay.
The Parameters of Pricing
The first factor in oil pricing is quality. The best kind of crude is light and sweet: "light" means its hydrocarbon molecules average on the small side within the oil range; and "sweet" means it does not contain much sulfur. Light, sweet crudes are the easiest to refine into petroleum products, which makes them more desirable than heavy, sour crudes.
No two reservoirs produce identical oil, though reservoirs in the same region often produce similar crudes. For example, conventional oils from Texas are generally lighter and sweeter than the crudes that make up the European benchmark Brent blend; this is why West Texas Intermediate crude oil carried a premium over Brent crude for years. Similarly, Bonny Light oil from Nigeria is a bit heavier and sourer than Algeria's Saharan Blend and therefore receives a slight price discount.
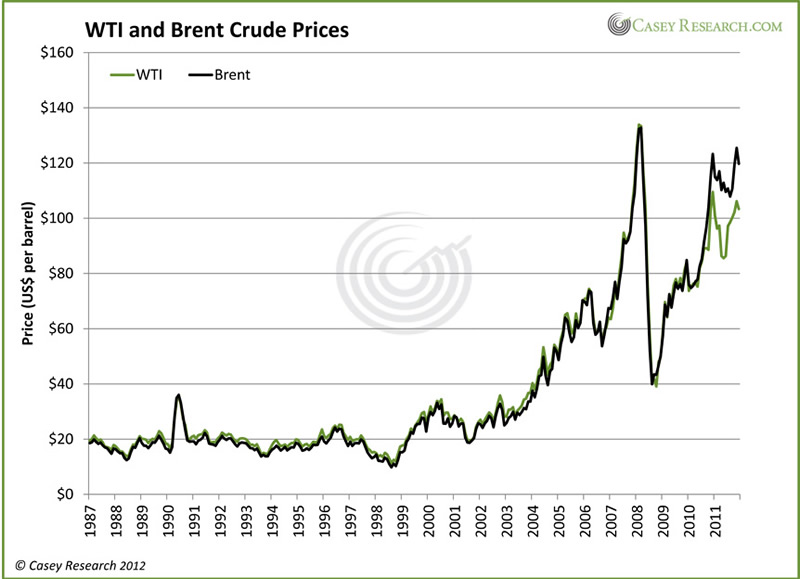
But wait, you say – isn't Brent more expensive than WTI? Yes, today it is. This graph shows the two prices' movements over the last 25 years.

For most of the graph the prices track very closely, with the green WTI line sitting just above the black Brent line. Then, in the second half of 2010, the relationship starts to shift: WTI prices started to lose ground against Brent. The differential was only a dollar in November 2010, but by September 2011 Brent crude was worth US$27.31 or 32% more than WTI. The differential narrowed in December but has recently opened up again, with the spot price of Brent closing US$13.88 above that of WTI yesterday.
The characteristics of WTI and Brent crude oils did not change during 2010, so the pricing reversal must have stemmed from the other factor that impacts crude-oil prices: infrastructure. More specifically, WTI prices started to slide because of a lack of infrastructure.
North America's Fantastically Flawed System
North America has a long history of oil production and processing. Decades of producing oil and consuming lots of petroleum products have left the continent with a pretty good system of pipelines and refineries… but pipelines are annoyingly stagnant things that tend to stay where you build them. And it turns out that the pipelines of yesterday are in the wrong places to serve the oil fields and refineries of today.
America's oil infrastructure was built around two inputs – some domestic production and large volumes of imports. You see, while the Middle East may be the biggest producer of crude oil in the world, most of the refining occurs in the United States, Europe, and Asia. There are two reasons for this. The first is that it's easier to ship massive volumes of one product (crude oil) than smaller volumes of multiple products (gasoline, diesel, jet fuel, and so on). The second reason is that refineries are generally built within the regions they serve, so that each facility can be tailored to produce the right kinds and amounts of petroleum products for its customers.
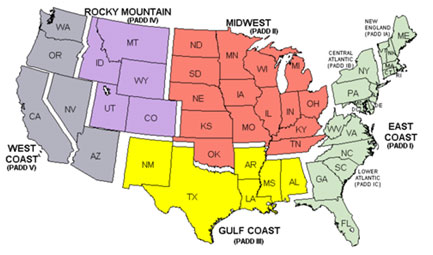
During World War II, the US War Department (now the Department of Defense) divided the United States into five regions to facilitate oil allocation. The regions were called "Petroleum Administration for Defense Districts," or PADDs.

The United States is split into five oil districts to help with regional administration of a crucial asset. Thanks to the US EIA for the map.
Today, refineries in PADD I on the East Coast process oil shipped to the district's Atlantic ports from all over the world. Its refineries produce enough petroleum products to meet about one-third of regional demand; the rest comes from imports of refined products, primarily from the Gulf Coast but also from Europe. PADD V, on the West Coast, processes domestic oil from California and Alaska, as well as imported oil.
While the East- and West-Coast PADDs are not connected to the rest of the crude oil system, PADDs II, III, and IV have become very interdependent. PADD III, on the Gulf Coast, has more refining capacity than anywhere in the world and accounts for 45% of total US capacity, with 45 refineries processing more than 8 million barrels of oil per day from countries like Mexico and Venezuela as well as domestic sources. Refineries in the Midwest and California push the US's total refining capacity to 18 million barrels of oil a day.
While domestic production has always helped meet the US's oil needs, imported oil has long ruled the day. The US has relied on imported oil so heavily for so long that the country's oil infrastructure is built primarily around refining imported oil and then moving refined products – gasoline and diesel and the like – north, from the Gulf Coast to the Midwest, or inland, from refineries on the coasts to customers in the interior.
It was not, it is important to note, designed to move oil from the interior of the country to refineries. But that is what is needed today.
Oil's a-Flowing, But with Nowhere to Go
North American oil production is on the rise in a serious way, and there are two prime culprits: the Bakken shale and the oil sands.
The Bakken shale formation underlying North Dakota gets most of the credit for the resurgence in US domestic output, though some of the shales in Texas are also contributing notably. Production in the Bakken is so booming that North Dakota's crude output topped half a million barrels a day for the first time in November, up from just 300,000 bpd in 2010. The state is on track to surpass both California (539,000 bpd) and Alaska (555,000 bpd) this year to become the number-two oil-producing state in the United States.
Oil from the Bakken is generally mid-weight and fairly sweet. Ideally it should stay in the Midwest, because the refineries around Cushing are still designed to process light sweet oil. However, the other area where North American oil production is booming produces just the opposite. In fact, oil from the Canadian oil sands is so heavy that it has earned a distinct moniker: "bitumen." And there is a tsunami of bitumen on the way. The two million bpd being produced in the oil sands today is set to increase 50% in just the next three years.
However, Canada's oil sands are not the only place in the world producing heavy oil. In general, global production is gradually moving towards heavier, sourer crudes because the easy deposits of light, sweet crude are being tapped out. And that has forced refineries to evolve.
A refinery designed to handle light, sweet WTI crude cannot switch to heavy, sour oil sand bitumen without some serious upgrades. To that end, US refineries have invested billions in upgrades over the last decade to enable them to process heavy oil. The catch is, now the refinery army along the Gulf Coast needs heavy oil – just as they couldn't easily switch from light to heavy, they can't switch from heavy back to light.
The obvious source is the oil sands. It's a win-win: Oil-sands producers want to get their oil to suitable refineries, and the heavy oil refiners on the Gulf Coast want Canadian crude, because without access to bitumen they are being forced to pay a premium for to secure heavy oil supplies from Venezuela.
But that potential win-win is instead a losing predicament for all, because the pipelines to move that oil simply don't exist.
Remember how the US's oil pipelines were designed primarily to move refined products from the Gulf region and the coastal refineries to inland customers? Well, those pipelines of yesterday now run the wrong way. Today what North America's oil machine needs are pipelines running from the oil sands to the Gulf Coast. At the moment there is just enough capacity to get bitumen partway there – it gets to Cushing, the oil hub. And then it gets stuck.

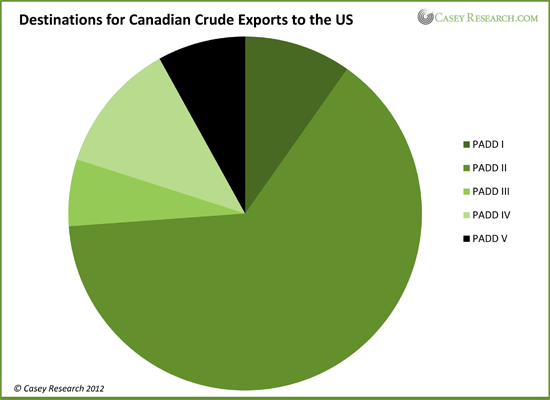
This chart tells the story perfectly. The vast majority of Canada's bitumen is ending up in PADD II – in Cushing – where it simply sits in tanks because there is no heavy oil refining capacity in the Midwest, and there is very limited pipeline capacity to move oil south.
Cushing is overwhelmed. The storage tanks at Cushing are at record levels, housing no less than 46.7 million barrels of oil. The recent reversal of the Seaway pipeline is helping – Seaway used to move refined products north from the Gulf Coast but has now been flipped to carry oil south. It is currently moving some 150,000 barrels of oil a day; volumes are expected to rise through the year to reach 400,000 bpd by early 2013. The pipeline's owners would ideally like to twin the pipe, but regulatory proceedings for that project are not yet under way.
The much-debated Keystone XL pipeline will also help. While routing and approval for the northern section of the pipeline are still under debate, construction of the southern leg of the project, running from Cushing to the Gulf Coast, is set to begin this summer. It could be operational before the end of next year.
But even with Seaway reversed and Keystone XL's southern leg in place, the glut of oil at Cushing will continue to grow. Production from the oil sands and the Bakken is simply growing too quickly for infrastructure to keep up. And when oil becomes landlocked, it loses that key characteristic – fungibility – that helps make it so valuable.
North American Oil Differentials: Here to Stay
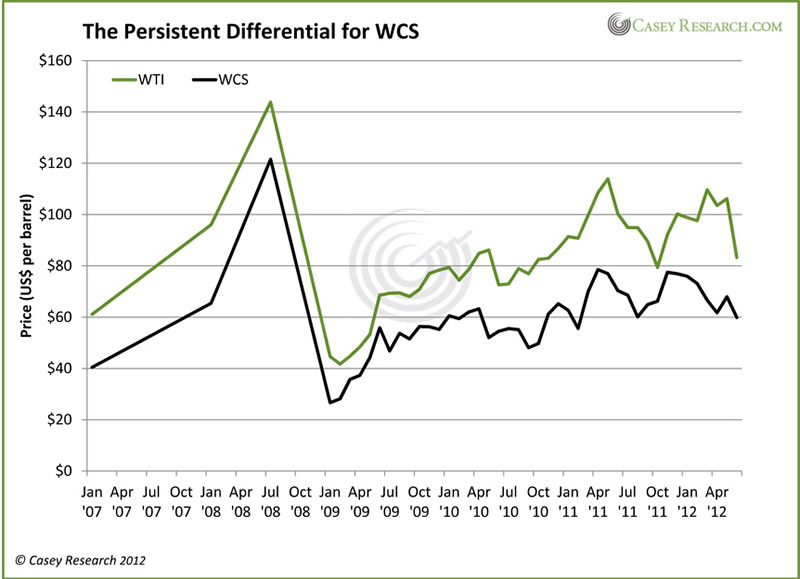
With so much supply landlocked, Canadian oil prices are taking a serious hit. The benchmark price for Canadian heavy oil is Western Canada Select (WCS), which is currently trading at just US$59.33 per barrel. By contrast, WTI is priced at US$82.70, which means the differential is a whopping US$23.37 per barrel, or 28% higher.

Even Canadian synthetic – a partially upgraded bitumen product that has historically carried a premium to WTI – is trading at a discount to its American peer: Canadian synthetic is at US$79.13 per barrel.
It's a double-whammy differential: Canadian oil is heavy, which discounts its price; and the system to move it to suitable refineries is clogged up, creating another discount. Neither of those situations is going to change any time soon, and that means oil-sands projects may soon be on the chopping block.
The oil sands is one of the costliest oil regions in the world to develop; and with WCS prices so low, the economics behind many new oil-sands projects have become pretty weak. New oil-sands mines require a price of around US$80 per barrel to break even. If an upgrader is part of the plans, that break-even price rises to almost US$100. In-situ projects, which use wells and underground steam injection to extract oil from the sands in place, usually carry a break-even price near US$60 per barrel.
But even with some projects postponed and others slowed, bitumen production is still expected to climb rapidly. Estimates range, but most observers agree that it is likely the oil sands will be producing close to 2.7 million barrels a day by 2016, up from 1.6 million bpd last year.
That kind of investment means that every time new pipeline and refining capacity is built, supply will catch up and the system will remain chockablock. And that means the differential between Canadian and US oil prices is settling in for a long stay. There are ways to benefit from this differential, but given the complexity of the situation, only informed investors will be able to take advantage.
You can't afford not to be an informed investor, as a new cold war – centered on valuable but dwindling energy resources – is heating up. Learn how to play it for maximum profit potential.
© 2012 Copyright Casey Research - All Rights Reserved
Disclaimer: The above is a matter of opinion provided for general information purposes only and is not intended as investment advice. Information and analysis above are derived from sources and utilising methods believed to be reliable, but we cannot accept responsibility for any losses you may incur as a result of this analysis. Individuals should consult with their personal financial advisors.
© 2005-2022 http://www.MarketOracle.co.uk - The Market Oracle is a FREE Daily Financial Markets Analysis & Forecasting online publication.


