GATA Gold Rally Targets $1000
Commodities / Gold & Silver Jan 29, 2008 - 12:10 AM GMTBy: Peter_Degraaf
 For the next few weeks or months, analysts will likely refer to the latest rise in the gold price, which started today, as the GATA RALLY.
As some of you know, this Thursday, the Wall Street Journal will carry a full-page advertisement paid for by GATA. The headline of the article will read: “Anybody seen our gold?”
The inference is that some of the gold that is supposed to be stored at Fort Knox may not be there, or may belong to foreign governments. The last time this gold was officially audited was 1953.
GATA has maintained for years, as originally reported by Frank Veneroso, and recently documented by John Embry, that the gold price has been manipulated by Central Banks and privileged bullion banks, along with some gold miners. (Barrick come to mind).
It is hoped that this advertising campaign by GATA will finally focus the light of truth on this dark issue.
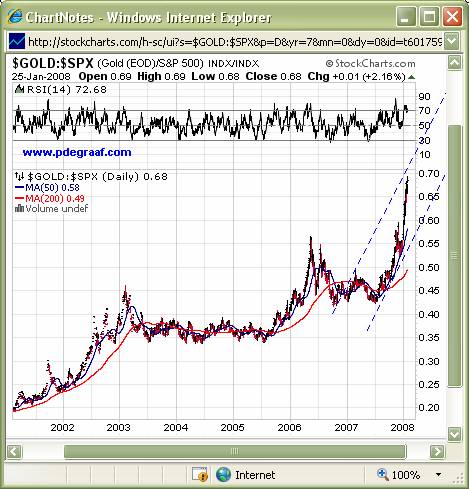
The question now before us is: How high can the gold price fly? The vast majority of investors are still being influenced by the Wall St. guru's who have for the most part ignored the fact that gold has outperformed main stream investments since 2001. Therefore there remains a lot of money that has not yet come into play. Charts courtesy www.stockcharts.com

Featured is the seven year history of the gold price compared to the S&P 500. Except for periods of consolidation, the trend has favored gold since 2001, and we may be looking here at a ‘moon shot'. This is probably one of the most important charts you can have in your arsenal. As long as this trend is up, gold will outperform mainstream stocks.
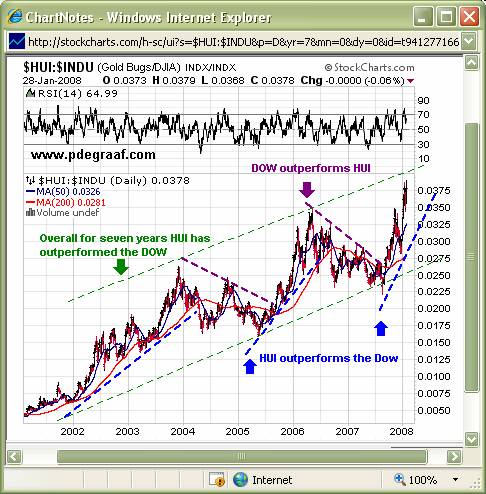
In this next chart we will examine the comparison between the stocks of the Dow, and the stocks that comprise the HUI Gold Stocks Index.

During the past seven years, since gold bottomed in 2001, gold stocks have consistently outperformed the DOW. “A trend in motion remains in motion until it is stopped”.
Until we see evidence that the trend is reversing, it behooves us to ‘trade the trend'.
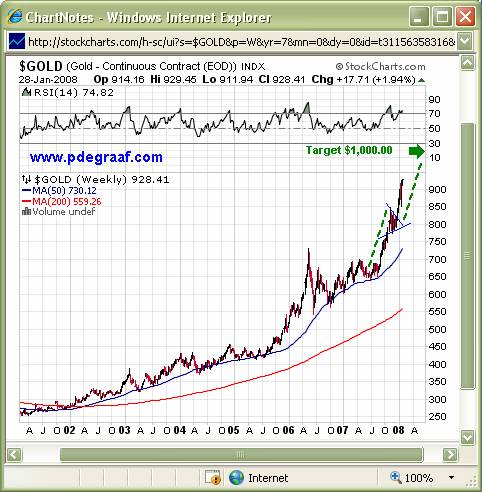
Next let's examine the Price of Gold itself.

Featured is the seven year bar chart for gold bullion. The breakout from the recent pennant (thin blue lines), sets up a target of $1,000.00 for this GATA rally. Emotional trading and frantic short-covering by some of the manipulators could send gold even higher, but $1,000.00 gold is the target.
Happy trading!
By Peter Degraaf.
Peter Degraaf is an on-line stock trader, with 50 years of investing experience. He issues a weekly Email alert. For a 60 day free trial, send him an Email at ITISWELL@COGECO.CA , or visit his website: WWW.PDEGRAAF.COM
DISCLAIMER: Please do your own due diligence. I am NOT responsible for your trading decisions.
Peter Degraaf Archive |
© 2005-2022 http://www.MarketOracle.co.uk - The Market Oracle is a FREE Daily Financial Markets Analysis & Forecasting online publication.


