US Stock Market Not Pricing in Recession!
Stock-Markets / Stock Market Valuations Jan 28, 2008 - 08:11 PM GMTBy: John_Mauldin

 What a difference a week makes! Recession talk is everywhere. This begs the question, are markets priced for such a possibility? We would suggest the answer is a resounding no. Valuation and cyclical risk are enormous. Yet, investors pile on the pressure by believing they can tell 'true' growth stocks from young pretenders. Simultaneously, investors seem to have transformed into speculators. This creates opportunities for those with the discipline to stick to their long-term process. Such investors are likely to find comfort in cash, if they are allowed. Failing that, large cap dividend paying stocks are probably the best place to hide.
- Cyclically adjusted measures of valuation send a clear message that US equities can not be described as cheap. In fact, they remain absurdly expensive on these measures. Of course, valuation is never a binding constraint in the short-term, but it is the primary driver of long-term returns. Moreover, valuations do tend to matter in bear markets more than bull markets.
- Some will argue that equities are cheap relative to bonds. We dislike such valuation measures as they confuse nominal (bonds) and real (equities) assets. One of the key lessons from Japan is that allegedly .cheap. equities got cheaper and cheaper against supposedly expensive bonds.
- The cyclical risk is a 'clear and present danger'. Yet investors have been piling on the pressure by playing a dash to trash - a desire to buy risk assets regardless of price. More recently this has become a grab for growth. Investors have been flailing around in a desperate search for any residual growth opportunity (such as emerging markets and commodities).
- The growth universe appears to be made up of two kinds of stocks. Firstly, the ones we would expect to find within this universe - the Googles, Apples and RIMMs of the world. These stocks have extraordinary cash flow growth embedded within their market price (in excess of 40% p.a. over the next 10 years) - surely madness. The second sort of stock in the growth universe are cyclicals masquerading as growth stocks. Some of the general industrials and the miners are priced for quite incredible long-term growth.
- So what should an investor do? Those who can, should hold cash and await the arrival of the 'fat pitch'. For those who have to be invested, you have my sympathies. However, sticking with a proven process is likely to be a source of long-term results. Whilst everyone else is trying to guess what will happen next month/quarter, the opportunities for time arbitrage are created. Focusing on the longer-term leads us to concentrate on dividends as these account for nearly half of the total return with a five-year time horizon. Thus large cap stocks that either pay a dividend (preferably a well covered one) or have the potential to turn cash piles into dividends are likely to be the best places to hide.
The dash to trash and the grab for growth
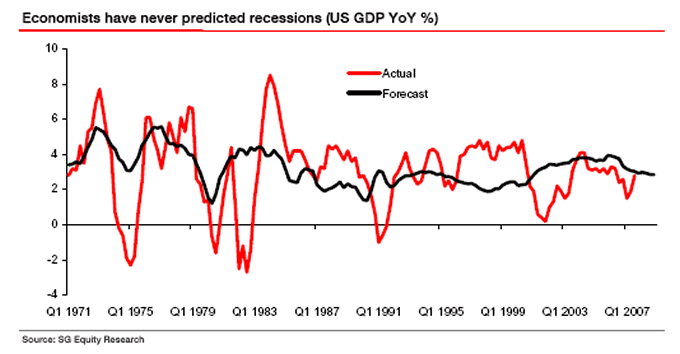
What a difference a week makes! Suddenly 'recession' is the talk of the town. Three big US investment banks are now predicting a recession (albeit a mild one). This tells us that we are almost certainly in a recession. Economists never forecast recessions until well after they have begun - that is if they manage to forecast them at all!
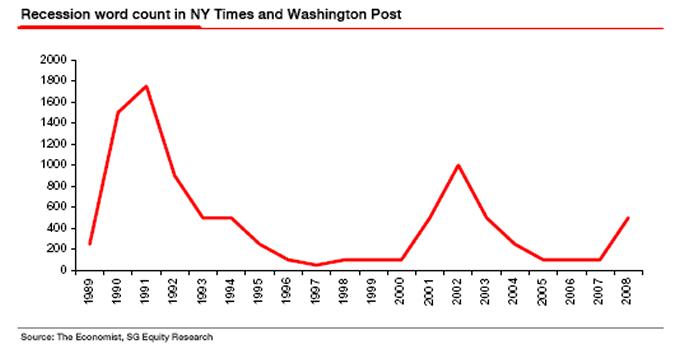
The Economist magazine's word count of recession in the NY Times and the Washington Post also shows a marked increase in the recent past.
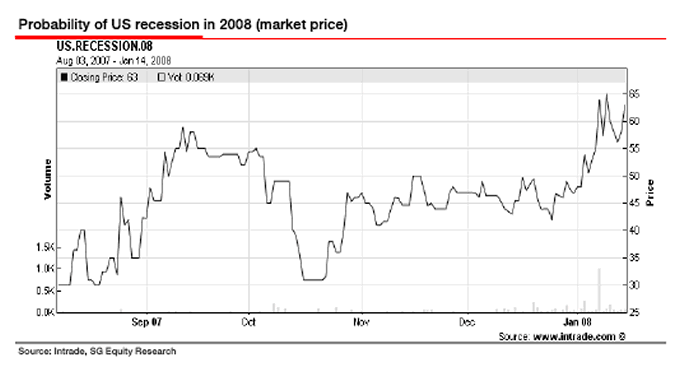
Intrade makes a market on a contract which prices the probability of a recession in 2008. This is currently showing almost 65% chance of a recession in 2008!
Cheap enough?
All of this begs the question: are markets priced for a recession? To us the answer seems to be a resounding no. Structurally equities remain exceedingly expensive. The chart below shows one method of cyclically adjusting the PE 1 using the process suggested by Ben Graham. He argued that we should abstract from the cycle by using "average earnings, which should cover a period of not less than five years, and preferably seven to ten years." The chart below shows the Graham and Dodd PE for the US market using a ten-year average of as reported earnings.
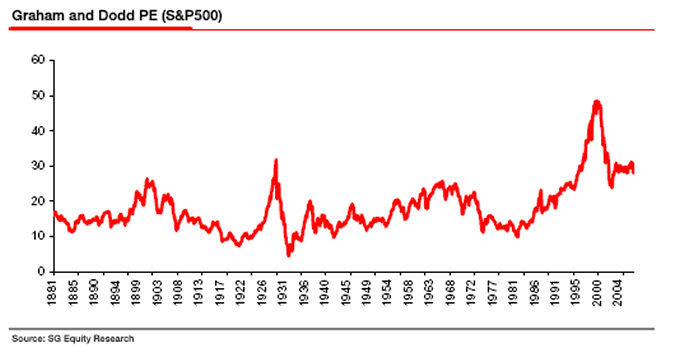
A cursory glance at the chart reveals that US equities couldn't be called cheap. In fact US equities are currently about as expensive as they have been anytime since 1929 (excluding the dotcom mania). Of course, valuations aren't a determinant of short-term returns. But they are the primary determinant of long-term returns. They also tend to matter during bear markets, far more than during bull markets.
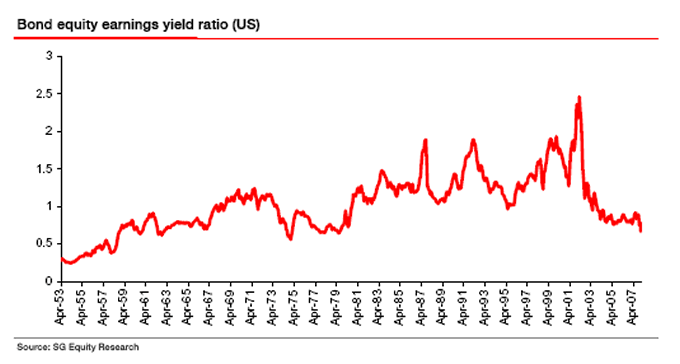
The favoured valuation measure of the bulls is probably the bond equity earnings yield ratio (BEER). The most frequently produced version of this covers the last twenty five years or so, and strategists using this measure extol the opportunity that the current twenty-five year low appears to offer.
However, this is likely to prove false comfort. The root of the problem with the BEER is that it compares a nominal asset (bonds) and a real asset (equities). Nominal assets are exposed to the ravages of inflation but benefit from deflation. Real assets find themselves in the reverse position. Thus the relationship between bonds and equities is likely to be driven by the inflation environment that dominates.
The chart below shows that the relationship between bonds and equities is highly unstable, altering as the inflation backdrop alters. It is also noteworthy that the BEER doesn't work empirically. It simply doesn't predict equity returns. So the BEER is flawed both theoretically and empirically.
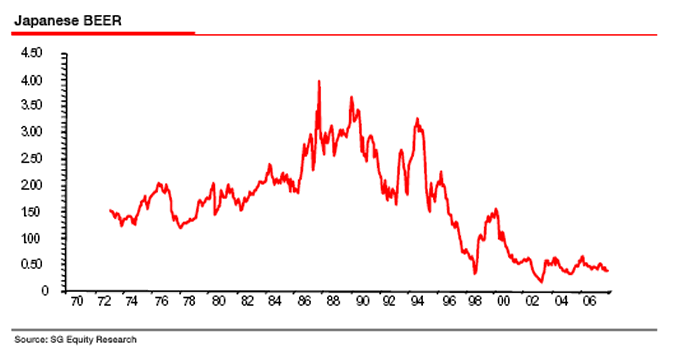
The final nail in the coffin for those who are advocating blind faith in the BEER is the evidence from Japan. Supposedly 'cheap' equities have done pretty much nothing except get cheaper relative to 'expensive' bonds.
Earnings risk - a clear and present danger
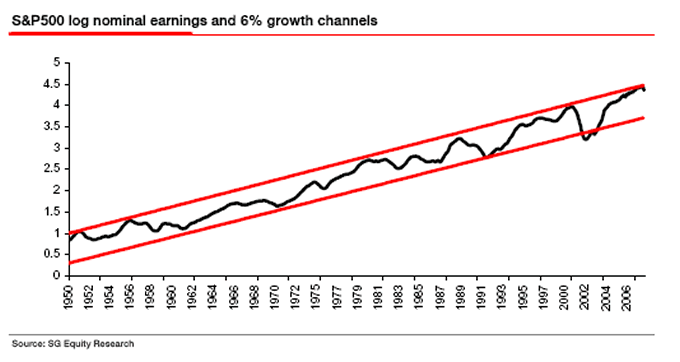
Not only do equities appear to have a structural headwind in terms of valuation, there is also a 'clear and present danger' from cyclical risk. The chart below shows the log earnings for the S&P500. I.ve added 6% growth channels to illustrate the point that when measured properly (i.e. peak to peak or trough to trough) US earnings have never managed to grow by more than 6% p.a. over a full cycle.
Of late, we have been tracking the top edge of this band. However, the series is generally mean reverting around its rising trend. This makes sense as profit margins are a highly meanreverting series - if they don't mean revert then capitalism is effectively broken. So simply from observing this chart we should expect a significant earnings risk to the market.
This earnings risk makes the forward PE - so beloved by many - as good as useless. As longterm readers will know I am not fan of using forward earnings as they represent the pipedreams of analysts rather than any likely outturn.
The US market is currently sitting on a 12-month forward PE of 14x. This may not sound like a lot compared to the 24x reached during the excesses of the bubble years. However, judging value relative to the peak of a bubble isn't a great idea 2 .
The average forward PE since IBES began collecting data is around 15x. Hence today's level of valuation can't be said to be discounting a deep recession. Additionally, the IBES data is very limited. We can have a pretty good guess what the forward PE would have looked like historically by adjusting the trailing PE by the average gap between forecast and trailing earnings. Such an exercise reveals that a longer-term average forward PE would be around 12x. This once again pours cold water on the arguments that the market is already discounting a recession.
As if this wasn't bad enough, in the past we have shown that analysts tend to be around about 10% too optimistic in their year-ahead forecasts of the earnings level. However, in recession years this jumps to 30% too optimistic. If this is the case then instead of $103 EPS that the consensus of analysts are forecasting for the S&P500 over the next 12 months, the actual outturn might be closer to $73 per share. This would take the forward PE from its current 14x to around 19.5x!
The dash to trash
Investor's behaviour is clearly incompatible with cognisance of this risk. For the last 18 months or so, investors (or should that read speculators?) have been engaged in what I.ve described previously as a dash to trash - a desire for low quality assets. In fact the lower the quality, the greater the demand has been.
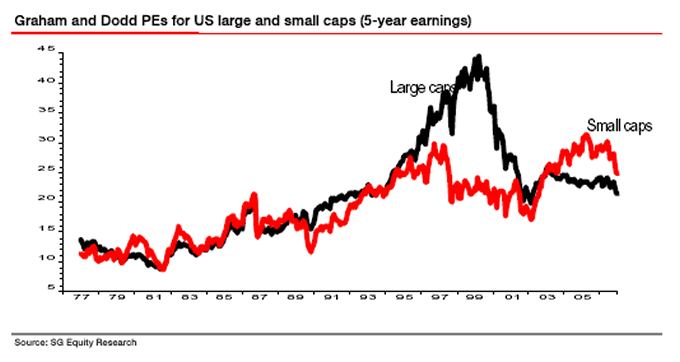
For instance, this love of risk regardless of value has created some obvious mis-pricings. Small caps trade at a premium to large caps, effectively the liquidity premium is negative. This makes no sense to me at all. Why would I want to pay a premium for stocks which are more illiquid, more idiosyncratic, and more cyclical?
As Ben Graham noted "Observation over many years has taught us that the chief losses to investors come from the purchase of low-quality securities at times of favourable business conditions."
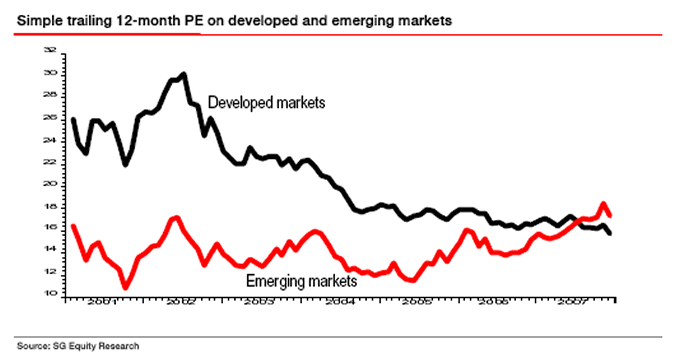
The fact that emerging markets now trade at a premium to developed markets is yet another example of this irrational complacency. Fans of these now relatively expensive markets are currently rotating their stories into part of 'the grab for growth.' Now all we hear are tales of decoupling.
These make little sense to us. For my perspective there are two major flaws in the decoupling arguments. Firstly, people always forget lags at the turning points in cycles. So if the US housing bubble bursting brings down the US consumer, it is ludicrous to assume that highly export-dependent nations will be able to withstand a demand drought.
Secondly, the decoupling arguments reek of cognitive dissonance - the desire to hold two contradictory viewpoints simultaneously. Those who now speak of decoupling used to talk of globalisation. This is oxymoronic, you can believe in one or the other but not both.
A grab for growth
More recently the dash to trash has mutated into a grab for growth. This smacks of late cycle desperation driving investors to flail around looking for the hope of growth. As we have written before, hoping for growth is always a dangerous strategy.
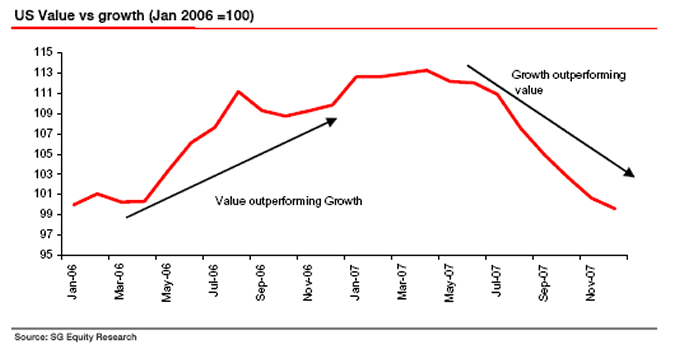
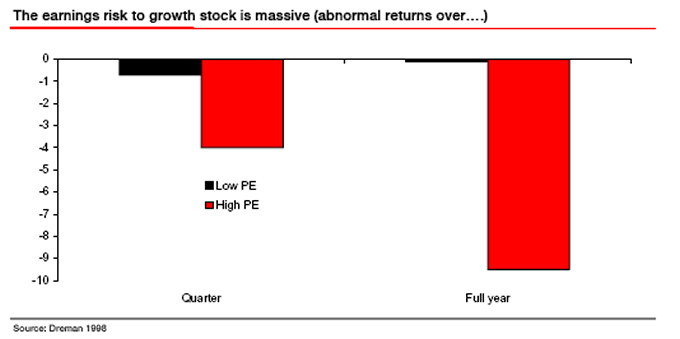
Despite the 'received wisdom', buying growth into a cyclical downturn is particularly foolhardy as far as I can see. We know that growth stocks which disappoint are massively punished by investors. The chart below is taken from the work of David Dreman 3 , it shows how stocks which disappoint perform in the wake of their earnings miss. Strangely enough when a value stock disappoints, not much really happens - as nothing very much was expected from it in the first place. However, when a growth stock disappoints, the consequences are far from trivial. On average it underperforms the market by almost 10% in the full year in which the miss occurred.
Some will argue that rotating into growth is a sensible thing to do, after all if growth is becoming scarce because of a slowdown surely a stock delivering growth should deserve a premium. Whilst there may be some truth to the basic logic of this statement it is essentially doomed to failure as a realistic strategy because we simply can't identify 'true' growth stocks.
The anatomy of growth
Currently the growth universe seems to consist of two sorts of stocks. The first are those that might be regarded as 'true' growth stocks. These are the Googles, Apples and RIMMs of the world.
It should be noted that these stocks require some quite unbelievable growth assumptions to justify their current prices. Using my very simple reverse engineered DDM model I take the analysts forecasts for the next three years (in order to be generous) and then back out what is implied by the market price in terms of growth over the medium term. In all three cases for the stocks mentioned above, a 40% pa growth rate is implied over the next 10 years - and that is just to justify the current price, never mind future returns.
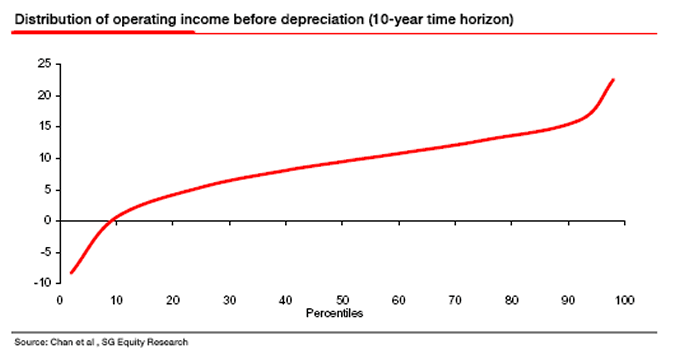
How likely is it that a stock will be able to generate 40% p.a. growth over the next 10 years? If history is any guide, it is next to impossible. The chart below is adapted from Chan et al 4 . It shows the historical distribution of firms 10-year earnings growth. Firms in the 99.99 percentile (the very best of the best) in terms of earning growth achieved a 22% p.a. growth rate over 10 years. So the 40% embodied with current market pricing looks highly suspect to us.
As if this weren't bad enough, a second sort of stock can also be found within the growth universe. These stocks are effectively cyclicals masquerading as growth stocks. They represent investors bets that the business cycle is dead, and that earnings risk is non-existent. Stocks falling into this category include some of the general industrials and the mining stocks. The consensus of analysts believes that the mining sector can grow 17% p.a. over the medium term.
However, analysts are essentially useless when it comes to forecasting medium-term growth. The chart below shows that the sectors which analysts expect to grow the fastest tend to actually deliver exactly the same growth as the sectors where analysts are least optimistic. Of course, the sectors with the highest expected growth have enormous scope for disappointment.
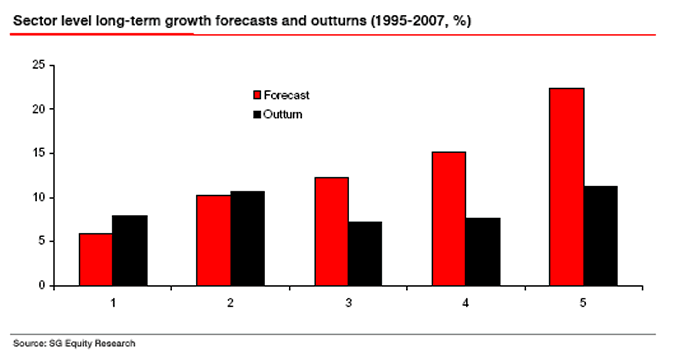
Using the same simple reverse engineered DDM model mentioned above, the mining sector is priced to deliver even more than the analysts expect! 20% p.a. over the next ten years. This seems like madness to me. But then again perhaps I just don't get it.
So what is an investor to do?
The most important thing to do is to stick with the processes that have served you well , but appreciate that the environment we are operating in may be altering. If in doubt, as I wrote last week, inaction and hence holding cash may well be the safest bet.
This remains anathema to most investors. The chart below shows the cash level at US equity mutual funds. Recently this was at a lower level than at the peak of the bubble. Even given the recent small rise (driven by asset decline, rather than cash increase), it still stands at a very low 4.2%.
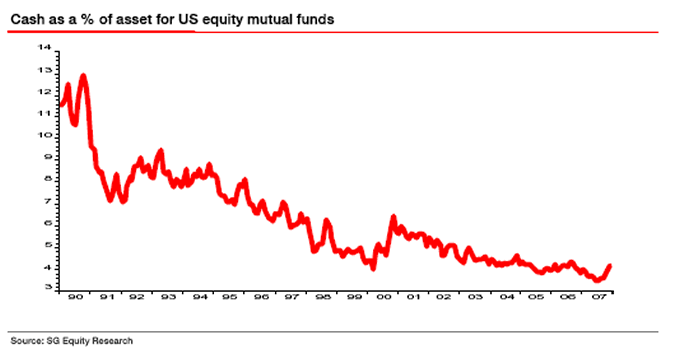
This low level of cash represents the outcome of a world in which specialised mandates insist on being fully invested, and where fund managers are focused on career concerns, and hence obsessed with tracking error and the short term.
Amongst a group I have previously identified as being some of the best value investors 5 , cash levels are much higher - often in excess of 20%. A couple are running cash above 40%. This doesn't represent an attempt to time the market but rather is the result of a failed search for bottom-up opportunities. They are not swinging at every pitch!
It is notable that in the previous sections the only opportunities I have been discussing are relative value orientated. That itself is a worrying sign, it testifies to the lack of absolute value to be found in markets.
As Ben Graham said "True bargain issues have repeatedly become scare in bull markets... Perhaps one could even have determined whether the market level was getting too high or too low by counting the number of issues selling below working capital value. When such opportunities have virtually disappeared, past experience indicates that investors should have taken themselves out of the stock market and plunged up to their necks in US Treasury bills."
As I noted in Mind Matters (13 December 2007), the average holding period for a stock on the NYSE is just nine months - consistent with the observation on the obsession with the short term. Of course, if everyone else is focused on the immediate future, mispricing of the long- term may well result. Perhaps the paradox of investing today is that the very thing that creates the opportunity (the myopia of investors) prevents most from exploiting the obvious time arbitrage opportunity.
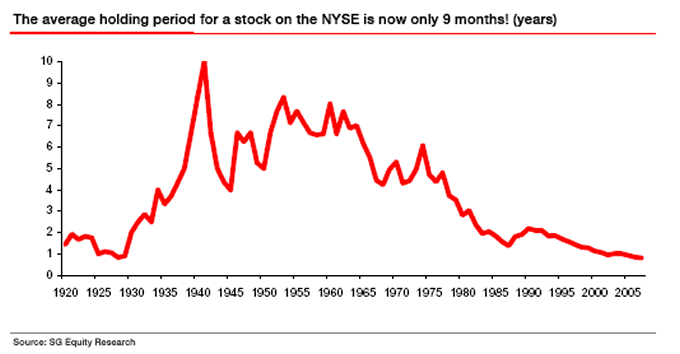
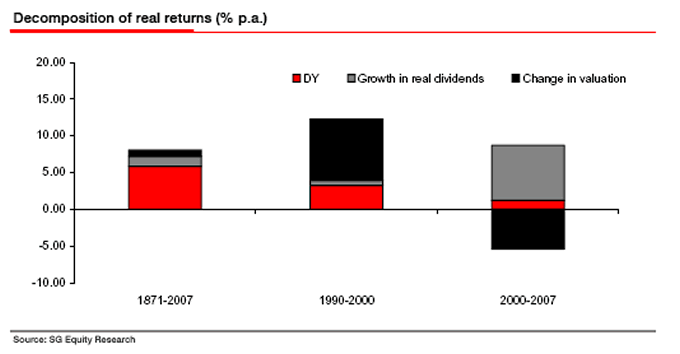
If you are investing on a 9 month time horizon (see chart above) then your returns are likely to be dominated by price returns. You are effectively simply betting on whether a stock goes up or down. In fact, the capital gain delivered via the change in valuation accounts for some 62% of your total real return if you have an annual time horizon (using data since 1871).
Consistent with this observation is the evidence that Andy Lapthorne presented in his recent Global Style Counselling, (7 January 2008) that momentum was by far and away the best performing style in 2007. This is one of the few factors that works on such a short time horizon.
However, if you are investing on say a five-year time horizon then the change in valuation accounts for only around 20% of your total real return. The vast majority of any longer-term return comes from dividend yield and dividend growth (see chart below).
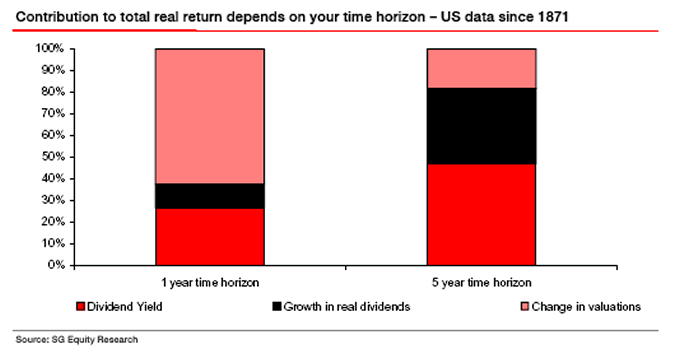
Thus one other obvious opportunity is to concentrate on dividends. If earnings risk and valuation risk are coming back to the fore, then investors are likely to be well served by concentrating on stocks with a degree of return certainty. That means concentrating on dividend yield.
In the 1990s, no-one gave a damn about dividends - they had become a dirty word, the paltry distributions to investors were irrelevant in a world in which capital gains were everything. Even today repurchases are the talk of the town. This is despite the fact that buybacks are used to distribute temporarily high earnings (i.e. earnings in excess above trend 6 ). If the earnings cycle fails then buybacks are likely to evaporate.
However, over a longer time period the importance of dividends is indisputable. The long-term evidence clearly shows that dividends have accounted for well over two-thirds of investor's total returns. The chart below shows this data.
I've also shown the picture over the last seven years. Strangely enough valuation has been a negative as the US market has de-rated. Given the appallingly low dividend yield available in 2000, it isn't any wonder that they haven't contributed much to total returns. However, what does become clear is the way in which the dividend surge (echoing the earnings growth) has driven returns to investors. Again, this doesn't bode well if the cycle is about to crumble.
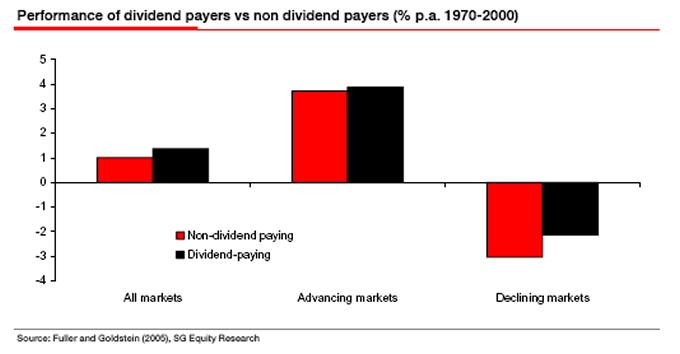
A recent paper by Fuller and Goldstein 7 highlights the importance of dividends, especially in down markets. Using data from the period 1970-2000, Fuller and Goldstein investigate the performance of dividend paying stocks and non-dividend paying stocks. Overall they find that dividend payers outperform the non-payers by around 4.5% p.a. The vast majority of this outperformance is delivered when markets are declining (when the dividend payers outperform by around 10% p.a.).
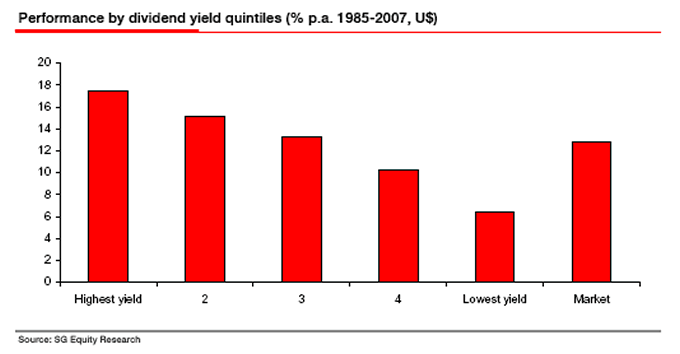
A simple dividend yield strategy has generated impressive returns in the past within Europe as well. The chart below shows the results of a simple backtest of dividend yield. We just bought the stocks with the highest trailing dividend yield. Such a strategy generated a long only return of 17.5% p.a over the period 1985-2007, against a market return of 13%. From a long/short perspective the return was over 10% p.a!
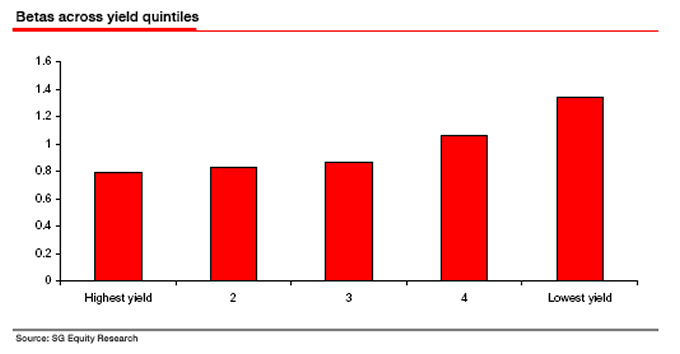
Nor is this outcome simply the result of taking on excessive risk. The chart below shows the betas across the quintiles. The highest yield group actually has the lowest risk (also true when measured using standard deviation) 8 .
Of course, many of the financials will be cropping up in these sorts of screens right now. For those who are afraid of significant dividend cuts, I ran a version of this test ex financials and the results were surprisingly similar.
In any bear market, one final trait to look out for is companies that are cash rich, but only pay a small dividend. These firms are likely to come under increasing pressure from corporate governance activists to return some of this cash hoard to investors.
A ray of hope?
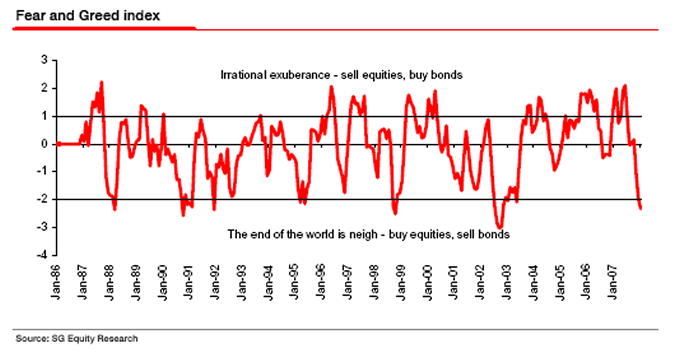
For those desperate to find something bullish to cling to the chart below shows our Fear and Greed index. It is a simple risk-adjusted price momentum measure between global bonds and global equities. It is a contrarian indicator, so when it is low it suggests equities may be attractive. The current reading suggests a buying opportunity may just be emerging.
With the Fed apparently panicking, perhaps they will unleash a 'Shock and Awe' policy response (to borrow an expression from one of my friends). In a world in which investors have been conditioned like Pavlov's dogs to respond to Fed action, such a policy response combined with an .oversold. reading on the Fear and Greed index could generate a sharp move up. As to the longevity of such an outcome - that is anyone's guess. And as should be obvious from all the discussion above, I strongly prefer to concentrate on the longer-term picture.
Conclusions
The US market is not priced for even a shallow recession - let alone a deep one. Investors are piling on the risk by blindly believing that they can tell 'true' growth stocks from the young pretenders - however, history suggests that a monkey throwing darts would generally do a better job!
Investors with an ability to hold cash should consider this option. Waiting for the 'fat pitch' may be one of the smartest ways of dealing with the current juncture. For those who have to be invested, discipline will be key. Sticking with a proven process and focusing on the long- term should bring (long-term) rewards. Tilting towards large cap, dividend paying stocks or large caps with the resource to transform cash piles into dividends are likely to be the safest place to hide.
Footnotes:
1 We use lots of differing methods, but all show a similar picture, so for the sake of brevity I will focus on the Graham and Dodd measure. Alternative averages (i.e. five years) give the same picture as well.
2 We know from the psychological literature that many people will do exactly this as we always tend to overweight our own personal experience when making decisions.
3 See Contrarian Investment Strategies.
4 Chan, L, Karceski, J and Lakonishok, J (2003) The level and persistence of growth rates, available from http://www.lsvasset.com /research/research.html
5 See Chapter 23 of Behavioural Investing.
6 See Chapter 44 of Behavioural Investing for more on this.
7 Fuller and Goldstein (2005) Do dividends matter more in declining markets? Available from www.ssrn.com
8 Andy Lapthorne is currently working on a far more comprehensive note on dividends and income strategies, including combining yield and cover screens.
Your always in the value camp analyst,
By John Mauldin
http://www.investorsinsight.com
To subscribe to John Mauldin's E-Letter please click here: http://www.frontlinethoughts.com/subscribe.asp
Copyright 2008 John Mauldin. All Rights Reserved
John Mauldin is president of Millennium Wave Advisors, LLC, a registered investment advisor. All material presented herein is believed to be reliable but we cannot attest to its accuracy. Investment recommendations may change and readers are urged to check with their investment counselors before making any investment decisions. Opinions expressed in these reports may change without prior notice. John Mauldin and/or the staff at Millennium Wave Advisors, LLC may or may not have investments in any funds cited above. Mauldin can be reached at 800-829-7273.
Disclaimer PAST RESULTS ARE NOT INDICATIVE OF FUTURE RESULTS. THERE IS RISK OF LOSS AS WELL AS THE OPPORTUNITY FOR GAIN WHEN INVESTING IN MANAGED FUNDS. WHEN CONSIDERING ALTERNATIVE INVESTMENTS, INCLUDING HEDGE FUNDS, YOU SHOULD CONSIDER VARIOUS RISKS INCLUDING THE FACT THAT SOME PRODUCTS: OFTEN ENGAGE IN LEVERAGING AND OTHER SPECULATIVE INVESTMENT PRACTICES THAT MAY INCREASE THE RISK OF INVESTMENT LOSS, CAN BE ILLIQUID, ARE NOT REQUIRED TO PROVIDE PERIODIC PRICING OR VALUATION INFORMATION TO INVESTORS, MAY INVOLVE COMPLEX TAX STRUCTURES AND DELAYS IN DISTRIBUTING IMPORTANT TAX INFORMATION, ARE NOT SUBJECT TO THE SAME REGULATORY REQUIREMENTS AS MUTUAL FUNDS, OFTEN CHARGE HIGH FEES, AND IN MANY CASES THE UNDERLYING INVESTMENTS ARE NOT TRANSPARENT AND ARE KNOWN ONLY TO THE INVESTMENT MANAGER.
John Mauldin Archive |
© 2005-2022 http://www.MarketOracle.co.uk - The Market Oracle is a FREE Daily Financial Markets Analysis & Forecasting online publication.


