Commodities Demand Speed Up or Slow Down--Don't Exit the Highway
Commodities / Commodities Trading Jun 19, 2012 - 03:36 AM GMTBy: Frank_Holmes
 When it comes to investing, wise managers are like good drivers, constantly evaluating the environment, looking for signs to step on the gas or slow down. A positive signal received recently came from Goldman Sachs, when the firm recommended "stepping back into the markets" in its latest Commodity Watch. Goldman is anticipating a 29 percent return for the S&P GSCI Enhanced Commodity Index over the next 12 months and suggests investors might want to increase their position in commodities.
Cautious investors might note that this is a significant change compared to the storm we've been driving through over the past several months. Goldman bases its view on a number of compelling factors that reveal improved conditions:
-
Prices have been pushed below fair value. Commodities have underperformed all other assets, says Goldman. The U.S. Global investment team tracks numerous resources subsectors' daily movements, and looking over the past 60 days, the Morgan Stanley Commodity Related Equity Index, as well as oil and gas, fertilizers, construction and engineering subsectors have experience double-digit declines, triggering a -1 sigma move. This is a sign that several commodities indices may be oversold; historically, these dips provided buying opportunities.
-
China and the U.S. have been posting improved data. Forward-looking data for U.S. survey data is more positive and China's activity measures have been "in line with expectations," says Goldman.
-
Policymakers are taking accommodative action. Recently, we've seen China cut interest rates for the first time since 2008. Australia and Brazil also cut rates, and Indonesia just introduced a stimulus plan to boost consumption and infrastructure spending, using $2.5 billion from the budget surplus to fund building projects as well as lift the tax-free annual income level, reports Bloomberg Businessweek. Some speculate that the U.S. might be next in making an easing move.
Central banks will do their best to provide liquidity to the banking system, says BCA Research. Recently, the Bank of England's central bank has "taken the lead," with total assets significantly accelerating after coming out with its own long-term refinancing operation (LTRO) program. England will provide six-month loans, as well as loans that are below market rates to banks for many years, to help drive lending to households and businesses.
Don't Miss the Entrance Ramp
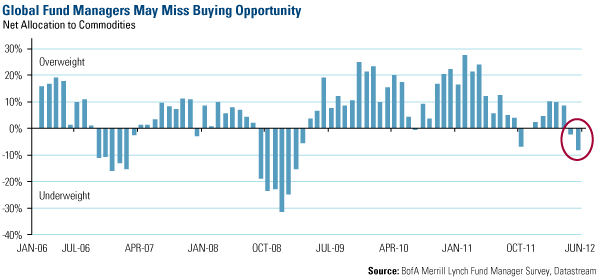
Many institutional managers have exited the commodities superhighway in favor of cash--currently at the third highest level on record--or technology stocks. In its global fund manager survey this month, Bank of America-Merrill Lynch found that advisors' allocation to commodities reached its lowest level since February 2009.

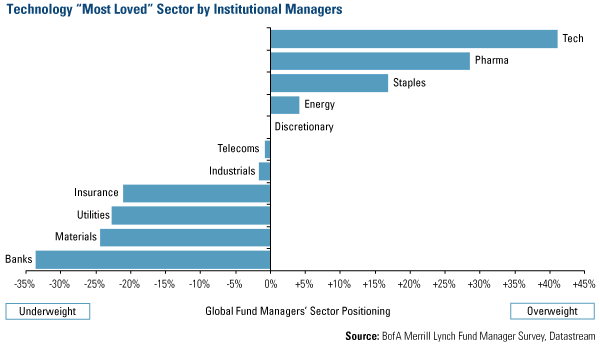
Instead of commodities, global managers are favoring technology. BofA-ML calls tech "the most loved sector by far," with managers' overweighting the sector an average of more than 40 percent. On the opposite side of the scale are basic materials and utilities sectors.

We've discussed this discrepancy in the market: While tech companies, such as Apple, cater to our wants, materials and utilities companies supply our needs. Global resources are needed to power the world: Utilities recharge Apple's iPhone, iPod and iPad, basic materials are needed to build the devices, and telecom companies keep us connected to loved ones.
Rather than veering in and out of sectors, there may be a better course for investors. Roger Gibson, one of the nation's most influential voices on asset allocation, charted a hypothetical investment of a dollar from 1971 through 2011 in three different portfolios: one in U.S. stocks, represented by the S&P 500 Index, one in commodity-linked securities which is the S&P GSCI Commodity Index and one for a 50 percent allocation in each, rebalancing every year.
His math shows that a hypothetical $1 in U.S. stocks over 40 years would be worth $42.60. The dollar invested over that same time in commodity-linked securities would be worth $34.56. However, a 50 percent allocation in each investment would yield the most, making $58.31 after four decades.
Another way to take advantage of a potential upturn in commodities is by choosing dividend-paying global resources equities. Like I told Pimm Fox from Bloomberg recently, I love income with growth--the combination is an important factor in our stock selection process. In the S&P 500 Index, nearly all of the materials and utilities stocks and more than half of energy companies pay a dividend that is higher than the 10-year Treasury. Materials and utilities companies yield an average of 2.3 percent and 4.1 percent, respectively, while energy stocks pay an average yield of 2.2 percent.
Driving on side roads at 25 miles per hour is an arduous way to reach a cross-country destination. In today's challenging economic environment, it's wise for investors to stay the commodities course, recognize the difference between what's in the windshield and the rear view mirror, and keep an eye on the road for unexpected obstacles.
For more updates on global investing from Frank and the rest of the U.S. Global Investors team, follow us on Twitter at www.twitter.com/USFunds or like us on Facebook at www.facebook.com/USFunds. You can also watch exclusive videos on what our research overseas has turned up on our YouTube channel at www.youtube.com/USFunds.
By Frank Holmes
CEO and Chief Investment Officer
U.S. Global Investors
U.S. Global Investors, Inc. is an investment management firm specializing in gold, natural resources, emerging markets and global infrastructure opportunities around the world. The company, headquartered in San Antonio, Texas, manages 13 no-load mutual funds in the U.S. Global Investors fund family, as well as funds for international clients.
All opinions expressed and data provided are subject to change without notice. Some of these opinions may not be appropriate to every investor.
Standard deviation is a measure of the dispersion of a set of data from its mean. The more spread apart the data, the higher the deviation. Standard deviation is also known as historical volatility. All opinions expressed and data provided are subject to change without notice. Some of these opinions may not be appropriate to every investor. The S&P 500 Stock Index is a widely recognized capitalization-weighted index of 500 common stock prices in U.S. companies. The NYSE Arca Gold BUGS (Basket of Unhedged Gold Stocks) Index (HUI) is a modified equal dollar weighted index of companies involved in gold mining. The HUI Index was designed to provide significant exposure to near term movements in gold prices by including companies that do not hedge their gold production beyond 1.5 years. The MSCI Emerging Markets Index is a free float-adjusted market capitalization index that is designed to measure equity market performance in the global emerging markets. The U.S. Trade Weighted Dollar Index provides a general indication of the international value of the U.S. dollar.
Frank Holmes Archive |
© 2005-2022 http://www.MarketOracle.co.uk - The Market Oracle is a FREE Daily Financial Markets Analysis & Forecasting online publication.


