Are Stocks Underperforming the Index? Case Study - Indonesia
InvestorEducation / Learning to Invest Jun 18, 2012 - 05:26 AM GMTBy: Sam_Chee_Kong
 There is always a believe that by holding Defensive Stocks and Blue Chips will enable you to weather the storm during a Financial Crisis. What we will be doing now is to build a case on whether holding on to stocks will outperform the Market Index. To do this we will use the Global Financial Crisis in 2008 as a backdrop in our study. We will be using the Jakarta Stock Exchange as a Case Study and our study will be based on the following assumptions.
- Period of comparison is from the 2007 High to Current value.
- Stocks in study will be the 10 largest listed companies in the JSX as of 2010
- Stock split and bonus are taken into account
Our mission will be to compute the performance of the top 10 index linked companies in the Jakarta Stock Exchange. As indicated by Index linked stocks, we mean that the performance of those stocks in question will be closely linked to the movement of the Jakarta Composite Index.
How do we compute the Index performance?
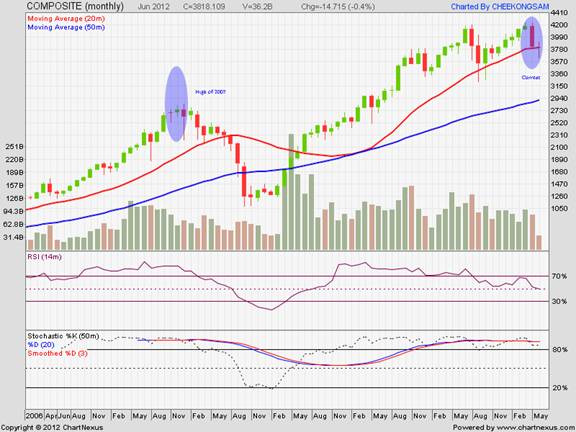
What we will do is to get the year high of the JCI during 2007 which was set on 12th December 2007 at 2818 points and the current (15/06/2012) level of the Index which is at 3818 points. The reason for using the High of 2007 is because we want to find out how much the current Index level had improved since then. Below is the monthly chart for the Jakarta Composite Index. To compute the performance of the Index we will use the following formula.
(Current Level-Previous Level/Previous level) x 100
Which will lead us to the following. (3818-2818/2818) x 100 = 35.5%
That means that the Jakarta Composite Index have recovered from the high of 2007 and managed to outperformed it by 35.5%. So obviously when we want to measure the performance of individual stocks, it must outperform the index by at least 35.5% since we are using index linked stocks where their performance is ‘closely hugged’ to the movement of the Index. That means if there is a 5% gain in the index for a given year, the index linked counters should be up at least 5%, if they are to outperform the index.
Table for Stock Performance from 2007 – 2012
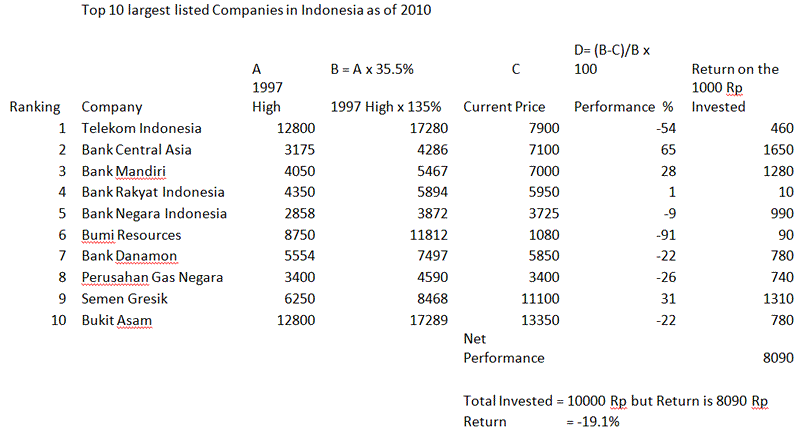
Index Linked Stocks Under-Performed the Index
As you can see from the above Table, if you have invested Rp1000 on the above counter during Dec 2007, the return you will get on 15/06/2012 is – 19.1%. Your total investment of Rp10000 will only yield Rp8090 which is a loss of Rp1910. So what we can conclude is that even though the index went up by 35.5% but the index linked stocks still UNDER-PERFORMED the INDEX throughout that period.
Compare to other Investments?
So how about other alternative investments? One of the best comparisons will be the Money Market fund. By Money Market we mean funds that are park at Stock Market accounts in Broking Firms. Indonesian money market pays pretty well and it can be in the vicinity of 9-10%. Ciptadana Sekuritas used to pay about 9% per annum for their Money Market account until the Indonesian Government stop Broking firms from accepting deposits recently.
Again using our same Rp10000 as the base investment so how much better would it compared to stock market investment from the time period in 2007 till 2012? To calculate the future returns on the present value of RP10000 we will use the following formula.
FV = PV(1+i)t where
FV = Future Value
PV = Present Value
I = Interest rate – 9%
T = time period – 5 in this case
So the FV = 10000(1+0.09)5 = Rp15386.24
Hence, we can deduce that during that period of analysis in Indonesia, the Money Market return (Rp15386.24) is better than the Stock Market return (Rp8090).
Why is this so?
The following offers some explanation on why Stocks tends to Under perform the Market Index.
Firstly, new stocks are added every year through IPO. At the meantime old stocks that are not performing or went into bankruptcy are delisted from the exchange. There are more new stocks added to the list than being taken out and hence the list of stocks grows every year. The Darwinian Law on survival of the fittest also applies to the stock market. Hence every year bad and poorly performed stocks are taken out of the list and new and healthy ones are added to the list.
If you look back at the records of Dow Jones for the last 100 years, less than 3% of the stocks managed to maintain their original name. For the past 50 years only less than 10% managed to do that. What does this tells us? A lot of the companies did not survive intact throughout the years, many of them either delisted, gone during a Merger, Acquisition or being Takeover exercise. And again along the way many new stocks are added while old ones are pushed out from the list.
This is one of the main reason why the stock market is always going up.
Secondly, the Composite Index is made up of only a handful of Stocks. Like the Dow is made up of 30 stocks, Malaysia's KLCI has 100 and so on. Normally these stocks have large market capitalization and hence also their weightage on the Index. Again it is the same old story, ‘not performing or tired’ stocks are taken out of the group and new ones are added into it. So this can be regarded as cheating and they can do continue doing this as long as the index keep going up.
This is also similar to Hedge Funds when they apply survivorship bias in their reporting. Since they are not under the jurisdiction of the Securities Exchange they are not required to report to them. In other words, they are free to cook their books. Under perform quarterly figures are discarded from their annual reporting and hence their reporting is always better than their actual performance.
So why do they want the market to go up? In my earlier article I mentioned that an overvalued market benefit everyone from the stock brokers to the politicians. Only us suckers got squeezed in the end because when the music stops, we are the ones will be the last to leave the party.
Thirdly, we only have ourselves to be blamed. Due to the propaganda by the market promoters and propagandist from the corporate mainstream media we are more or less afflicted with a disease called ‘Normalcy Bias’.
Normalcy Bias refers to a situation where the mental state of the people failed to estimate the possibility and effects of a disaster that is looming. When facing a stock market crash instead of taking evasive action to cut loss we tend to focus on the unexpected event and enter into a state of paralysis. It is normal for investors to be overwhelmed by losses and hence failed to do the right thing and that is to get out of the market. This is because we are constantly fed with ‘good and soothing’ stories by the mainstream media and condition our mind to accept that things are always in good hands and order. Consider the following quote,
"The man who never looks into a newspaper is better informed than he who reads them; in as much as he who knows nothing is nearer to the truth than he whose mind is filled with falsehoods and errors." – Thomas Jefferson
Where is the Problem?
The main problem is us. Why? Because we did not time the market because we always believed that the market will always deliver. In other words we didn’t sell when the market says SELL and we just hang on with the Investments. When the next downturn comes around, you will find that your gains will be wipe out and worse still a negative return on your capital as shown by our example above. So we must learn to TIME the market. Sell when you need to and buy back later at an appropriate price.
As for an illustration we shall take Telekom Indonesia as an example. The following is the weekly chart for the Telekom Indonesia from the period 2007 – 2012.
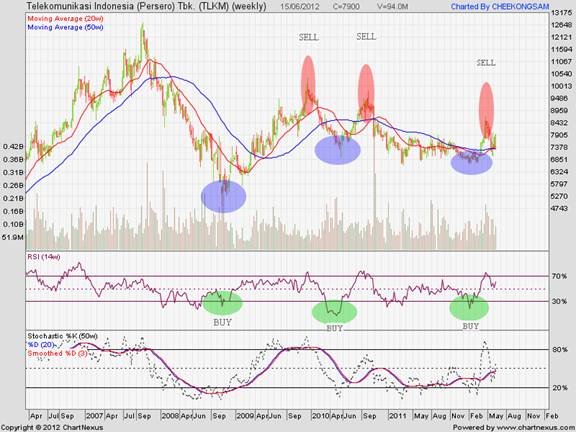
I have already marked the BUY signal using the GREEN circles and SELL price using the RED circles and BLUE circles for BUYING in price. As you can see from the chart there are three different opportunities for you to greatly increase your return by selling when the price goes above the 70% line in the RSI and buy when it goes below the 30% line in the RSI.
This represents only one of the simpler method you can trade the market, however as you go along you will find that you need much more complex tools to study the market more professionally. Eventually you will need to understand support and resistance, rebounds and declines percentages, pivot points, market turning indicators, time series and many more if you want to improve your trading techniques.
Trading in markets is never an easy task as many perceived, you need to put in a lot of effort and you need sweat blood over your analysis. It is not like launching a ‘fire and forget’ Exocet missile because in financial markets there is nothing such as ‘buy and forget’ kind of strategy. You will need to manage, monitor and also rebalances your portfolio every now and then.
As for myself, I am monitoring more than 17 Global Stock Exchanges and 2 Futures Exchanges. This is because due to the nature of financial markets which is affected by tens if not hundreds of variables and ‘Change being the only Constant’, we need to constantly update ourselves. This is also due to the fact that today’s financial markets are more closely linked than ever before. A drop of over 500 points in the Dow will affects Asian Markets when they open the next morning and a huge drop in corn prices as a result of selling frenzy in the Futures Market will surely affect American corn farmers in the days and weeks ahead.
Currently I had started using Spectral Analysis where its approach to the market is similar to Fourier Transform. Geologists have long been using Spectral Analysis to analyze data from their oil drilling operations with great accuracy. Fourier Transform is also being used to analyze vibrations in aircraft wings. A good article on using Fourier Transform to determine the relationship between oil price and Presidential Elections by Tom Theramus can be read from here. http://samcheekong.blogspot.com/2012/03/using-fourier-transform-to-study.html
Both of them study the Stock Market’s Sine Wave to determine actual entry and exit points. The advantage of using Spectral Analysis in analyzing Financial Markets is that it needs less data to achieve better accuracy and results. So that means we can use Spectral Analysis for stocks that have less than 3 years of historical data.
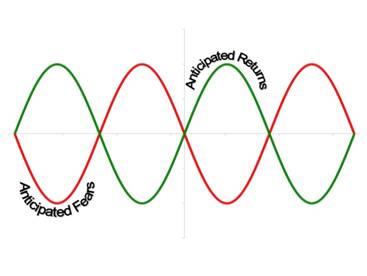
It is known that movements in Financial Markets mimics the Sine Wave with peaks and valley quite evenly distributed. These peaks and valleys are the result of human emotions of greed and fear. It best can be described with the following graph.
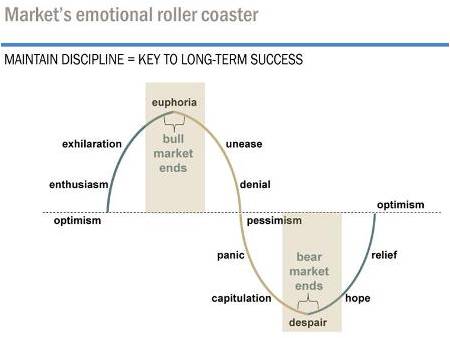
Our objective is to use the correct tools to help us identify the ‘Soft Spots’ in these peaks and valley. Identifying these soft spots is akin to Tennis Players trying to hit the ball on the soft spots (located at the center of the racket) in their racquets. These peaks and valley are our soft spots for entry and exit points in the markets. It can be shown by the following.
by Sam Chee Kong
cheekongsam@yahoo.com
© 2012 Copyright Sam Chee Kong - All Rights Reserved
Disclaimer: The above is a matter of opinion provided for general information purposes only and is not intended as investment advice. Information and analysis above are derived from sources and utilising methods believed to be reliable, but we cannot accept responsibility for any losses you may incur as a result of this analysis. Individuals should consult with their personal financial advisors.
© 2005-2022 http://www.MarketOracle.co.uk - The Market Oracle is a FREE Daily Financial Markets Analysis & Forecasting online publication.


