


Crude Oil Demand Recovery Is Unlikely
Commodities / Crude Oil Jun 17, 2012 - 02:41 AM GMTBy: Andrew_McKillop

 "World oil consumption will rebound next year as the global economy recovers, according to a report released by the Paris-based International Energy Agency which said it expects global oil demand to grow 1.7%, for an increase of 350,000 barrels per day from its previous estimate".
The only problem with the serial oil demand growth-forecasting reports from the IEA is the above example dates from.... September 2009. At that time, crude for November delivery was trading around $71.75 a barrel for WTI grade.
Why oil demand did not rebound is the real question, and the reasons for this are not only due to GDP change or oil prices but are wide ranging - and will go on growing. This especially affects the European Union countries, the US and Japan, which are the three main oil consumers in the IEA's 28 member states, using a combined 44.25 million barrels a day (Mbd) as of March 2012, almost exactly 50% of world total oil demand.
WHAT HAPPENED
For the IEA, despite the graphs, charts, tables and diagrams it prints in its oil and energy reports, only the global downturn, from 2008, cut oil demand. The IEA theory is that when (or if) the economy rebounds, oil demand will also rebound - leading the IEA to always forecast higher oil demand in the future "when the economy rebounds".
The real world shows a different readout. The chart below is what happened to the EU27 plus 2 non EU european countries of the OECD Europe group through 1995-2011.
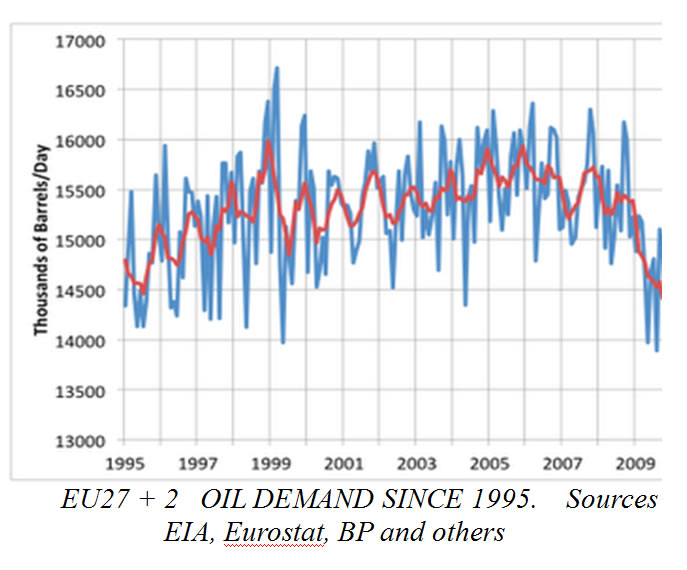
The problems for the IEA and other energy watchdog agencies of the mostly oil-importing OECD countries, like the US EIA, start with the basic conceptual model they use for oil forecasting, which is disproved by a single chart, like the one above. For these agencies, the global economy's surge through 2004-2007 drove high, or very high growth rates of oil demand, even in the OECD economies. This was not the real case: at the time it was only true for China, India and other Emerging economies.
The high-growth outlook certainly applied to ever-industrialising China and India, and a host of other non-OECD G20 countries, from Brazil to Turkey, South Africa and Indonesia, in that 2004-2007 period but in fact, however, this was already turning down and already "rearview mirror" thinking
This is because firstly India, then China started slashing the oil intensity of their economies, their oil input per unit of GDP output, from as early as 2000-2003. This had and has a fast escalating impact on their trend rate of oil demand growth.
This is shown by two simple figures. Through 2001-2011 China averaged 9.7% per year growth of its oil demand, and India about 5.7% (depending what figures are used for India's oil demand). This growth was however front-loaded in time, with more regular and usually higher-than-average growth in 2000-05 than in 2006-11. Forward estimates and forecasts for oil demand growth of both India and China are now up for grabs: they may hold up, if economic growth holds up, but they are more likely to slump. For India, the official figure is about 3% per year growth of oil demand if GDP growth holds at more than 6% per year. China is unlikely to ever again have annual growth rates of oil demand more than about 7% and that figure now looks high.
This slump in oil demand growth by "Chindia", for sure and certain, will have plenty of psychological impact on oil traders at their playstation consoles, because pre-2008 forecasts for Chindia's growth of oil demand could be rationally set at more than 0.8 Mbd per year, every year going forward. This led to annual readouts of global oil demand always scraping very close to the supply ceiling, making oil price breakouts a permanent threat.
For some while, and getting clearer every time in its reports, the IEA is now looking for Chindia oil demand growing at below 0.4 Mbd a year, if GDP growth holds up. Adding this mega change to the outright contraction of oil demand in the OECD group, the outlook for total flat-line global oil demand is strong, with contraction coming soon, unless the global economy surges as in 2004-2007 which is fantasy economics under current and emerging conditions.
FAILURE OF THE PRICE ELASTIC PARADIGM
IEA reports like its flagship WEO, and its subscriber-only pay to read market analyses, heavily rely on price-elastic forecasting tools, to set oil market demand, and predict oil price changes. This approach refuses to accept the real nature and process of oil price setting: traders at their playstation consoles, playing the candlestick charts - with almost zero interest in oil price impacts on demand, or any other demand/supply fundamentals. And regarding oil prices, the traders are right: oil demand in the OECD groups, then in China and India was totally impervious to oil price rises - for decades.
Only changes in GDP growth rates, or GDP contraction during recession impacted and affected oil demand, not prices. Technology impacts were low. Policy impacts were low. Whatever the oil price was, consumers would buy it. This was the old paradigm and it worked.
Due to oil prices being set in and by the trader circus, prices are only and can only be volatile: from the July 2008 Nymex price peak for WTI of $147 per barrel, prices crashed to $35 per barrel 1 year later: the price-elastic paradigm predicted a massive rebound growth in oil demand, which never happened. To be sure, GDP growth fell out of bed for most OECD countries, from 2008, making it respectable for price-elastic coefficients and indices to fail in their forecasts of oil demand rebound, and hide the basic failure of the price-elastic paradigm.
In the upstream and for the global energy majors, the price-elastic reaction to falling oil prices was massive, sure and rapid: their E&P (exploration & production) spending on oil was cut by 33% from 2008, and only started recovering in late 2011. To be sure, the strategy of big energy corporations is simple: keep oil prices high enough to pay for E&P and maintain earnings on oil, but their de facto strategy is to back out of oil, starting with the upstream, and focus the world's newly appreciated nd ultra massive gas resources. This Gas Shift process for the energy majors is under way from the start of the 2000 decade, and much too far advanced to turn back now, but the oil price risk of this de facto change of focus by global energy corporations is bemoaned by the IEA in strident language.
When or if oil "came back to its senses" and the economy recovered, and oil demand started seriously growing - - the IEA sets that for 2015 - - oil shortage will soon bite, and prices will explode. The IEA sets the price range as $175 - $200 per barrel, for the 2015-2017 period. It then goes on to forecast Economic Doom of the type last known in the 1973-74 and 1979-81 oil shock panics.
OUTDATED THINKING
The IEA itself gives the key figures showing why this will not happen a third time around. Comparing OECD energy dependence of 1973 and 2009, it shows that the richworld's group oil dependence fell from 52.6% of its total energy demand, to 36% in 2009. Since 2009 the process continues, and especially in Europe. The argument that final user oil prices are highest in Europe, therefore backing oil out of the economy runs faster in Europe - the price elastic theory - faces the problem of nearly all European governments applying "near punitive" taxation to motor fuels for decades. Through 2008-09 for example, as traded crude peaked and slumped from $147 to $35, pump prices declined a few percent - and demand went on contracting.
The US, usually used by oil analysts as a "more transparent" priced energy market due to lower levels of Federal and State taxation of oil, shows a similar process under way. Since its all-time peak in 2007 the US car fleet's oil demand has fallen 0.6 Mbd (about 6.5%), despite a small growth in car numbers, and pump prices down by 33% from their peak in 2008. Again there are multiple reasons, especially the rapid penetration of more fuel efficient cars in the fleet, but other changes also operate, even including more public transportation, the rising average age of drivers, fewer trips per year and lower average distances per trip. The famous price-elastic factor, feared by the IEA when oil prices drop, and cheered by the IEA when oil prices soar, had little look-in to the real world process of change.
Certainly since 2000-2005 the upstream oil supply side has only shown slow growth of net supply, despite the impressive global oil E&P spending (peaking at more than $325 billion in 2008), which has shifted the majority attention of analysts to the oil demand side. Unfortunately however, the price-elastic paradigm still rules the roost, making it still possible for the IEA to forecast a theoretical oil crunch and price explosion by about 2016. The chart of European oil demand in this article, above, tells another story, but the full story also includes non-oil energy.
In Europe, since the December 2008 European parliament vote for the 'climate energy package", called the energy transition policy by most EU27 deciders, this policy and programme package has in fact only indirectly targeted oil saving and substitution, despite the rhetoric in the Commission's supporting documentation, and the rhetoric in EU27 political party treatment of the package. Like the surprise success of the package in technology and industrial terms - cranking up installed renewable energy systems and their output at about 25% a year for windpower and 40% a year for solar power equipment from before the 2008 vote - the oil fadeout in Europe is also a surprise. As in the US, this has little to do with price-elastic behaviour of theoretically rational economic agents operating in a perfectly transparent price environment.
More simply, oil does not fit the emerging energy economy, in which "energy lean" has a real meaning. The surprises continue with the "climate" side of Europe's new energy programme, where public belief and acceptance of the global warming catastrophe theory has seriously flagged, as everywhere else. CO2 consciousness, measuring the CO2 implications of everything from a cup of tea to a jet trip to Bali has generated energy consciousness, with direct earnings and savings potentials for all members of society. Chasing oil out of the energy mix decreasingly needs the prop of CO2 credits or offsets, and is increasingly driven by basic ROI analysis.
SPREADING THE VIRUS OF OILSAVING
IEA data shows that Emerging and developing countries, including low income countries still use oil for electric power production: about 2.25 billion barrels in 2011.
This oil demand sector will become one of the hot targets for saving and substitution investment action, and due to now industrially mature mass production of windpower and solar power equipment the process of slashing this oil demand can move rapidly. For the low income countries, some of which still use oil to produce over 50% of their electricity (US oil-fired electricity 2009: 1% of total), the fast growing supply of newly obsolete solar and windpower equipment in the North, specially Europe, becomes a key resource. Leapfrogging tech development of windmills, for example, has seen their power spiral from 600 kW to 6000 kW (6 MW) per mill, leading to rapid economic obsolescence of smaller mills built to operate 30 years or more, but retired in less than 10 years. This type of equipment is often priced at giveaway prices, as low as $500 per kW. Heavy discounts also operate on economically obsolescent solar PV equipment, having typical efficiencies of below 12.5%, compared with new equipment attaining 18%, but with service lifetimes for both at or above 30 years.
Downstream oil use in the economy, in Emerging and developing countries features many end uses which like oil for power production in the OECD group are a historical curiosity. Industrial oil demand remains high in these countries, ranging from steam raising and heat treatment to a range of other industrial uses, where cutting the oil need through a host of measures and means is perhaps not "sexy" but pays big returns. Inside industry, natural gas is the oil-killer with equipment and installation costs on a one way downward track.
Transport oil saving in the Emerging and developing countries will also deliver very big payoffs - using gas - and showing how this forecast of accelerated energy transition is going to play out in the South as much as North, gas-powered car, truck, bus and rail transport is growing faster in several Emerging and developing countries (including Pakistan, India and Iran) than in the OECD countries. This transport energy shift can be compared with lower income countries installing cell phone networks without first developing landline networks, and the same fast-start infrastructure spending economies are implied by shifting transport to the gas-powered future, and bypassing the OECD model's oil-fuelled present.
Worldwide, the shift to zero growth, and then decline of global oil demand is set by the IEA and lookalike agencies as a subject for 2035 or later. The future is coming much faster than that: zero growth is already a near-term future bet; decline on a year-in year-out annual basis is now mapped for starting by or before 2020.
By Andrew McKillop
Contact: xtran9@gmail.com
Former chief policy analyst, Division A Policy, DG XVII Energy, European Commission. Andrew McKillop Biographic Highlights
Co-author 'The Doomsday Machine', Palgrave Macmillan USA, 2012
Andrew McKillop has more than 30 years experience in the energy, economic and finance domains. Trained at London UK’s University College, he has had specially long experience of energy policy, project administration and the development and financing of alternate energy. This included his role of in-house Expert on Policy and Programming at the DG XVII-Energy of the European Commission, Director of Information of the OAPEC technology transfer subsidiary, AREC and researcher for UN agencies including the ILO.
© 2012 Copyright Andrew McKillop - All Rights Reserved Disclaimer: The above is a matter of opinion provided for general information purposes only and is not intended as investment advice. Information and analysis above are derived from sources and utilising methods believed to be reliable, but we cannot accept responsibility for any losses you may incur as a result of this analysis. Individuals should consult with their personal financial advisors.
© 2005-2022 http://www.MarketOracle.co.uk - The Market Oracle is a FREE Daily Financial Markets Analysis & Forecasting online publication.