Gold Price $1525 Support Seems Likely to be Broken
Commodities / Gold and Silver 2012 Jun 12, 2012 - 07:25 AM GMTBy: Brian_Bloom
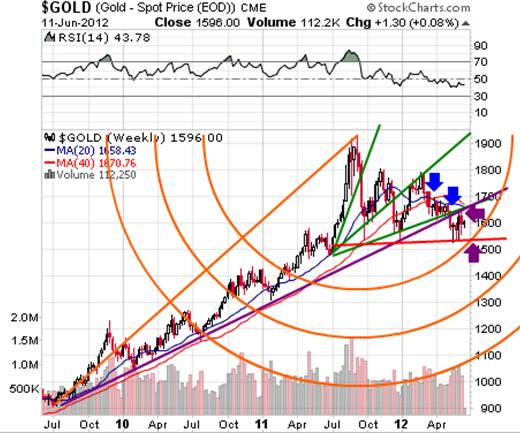
 Speaking dispassionately, the chart below (courtesy stockcharts.com) shows three historically bearish break-downs (blue arrows) and three potentially important bearish developments (purple arrows).

Blue arrows:
1. Cross-over of 20 week MA below 40 week MA (first time in three years)
2. Break of gold price below third green fan-line
3. Simultaneous to 2. above, the gold price broke below rising purple trend line (This is very significant because the intersection of these two trend lines offered strong support)
Purple arrows (breaks may not happen but significant if they do):
1. Anticipated break of 20 week MA below rising purple trend line
2. The short term upward technical reaction of the gold price – following the break below the rising purple trend line) stopped at the (now) resistance of that rising purple trend line
3. $1525 is the intersection of horizontal red support line (base line of typically bearish descending trend line) and the first Fibonacci support level (orange semi-circle). This intersection represents strong support which – if it is penetrated on the downside (as happened at the intersection of the green and purple lines, where the second blue arrow points) – will be a very significant breakdown.
We cannot sensibly make the call yet, but a break below the third fan of a three line formation typically heralds a secondary bear reaction within a Primary Bull Trend. With this in mind, and with the upward (short term) technical reaction having stopped below the rising purple trend line, the probability of a break-down at the second purple arrow is not low. Note that the third orange semi-circle offers support at around $1100 – which is where the 3% X 3 box reversal Point and Figure chart is targeting that the move will end.
Conclusion
It seems likely that, within the next week or two, the market will come to understand that a “hyperinflationary” solution to the European financial crisis is very unlikely given that the European Central Bank has a monopoly on printing Euros. The reason is that it is very unlikely that the ECB will bypass the double entry bookkeeping convention and just “print” money with no matching debits showing Euro denominated loans owing. i.e. Inflation of the European money supply will be matched by growth of debt levels within Europe.
Author comment:
I am not a financial adviser, but if I were a betting man, I would bet that the gold price will soon resume it secondary southward move within its Primary Bull Trend. My reasoning is very simplistic: If any European country were to unilaterally withdraw from the EU, then whatever debt it has in Euros would have to be treated as a potential bad debt in terms of Generally Accepted Accounting Practice (GAAP). Applying a “reasonable man’s” argument , if Greece were to unilaterally withdraw (or be kicked out), it is quite reasonable to expect that the Greek Government would no longer have the support of the ECB and would need to print drachmas to pay its bills. The flip side of this would be that the drachma would collapse relative to the Euro – implying that Greece’s sovereign debt that is denominated in Euros would almost certainly be rendered unpayable. In turn, writing off Greece’s sovereign debt would have a “knock-on” effect because the five large banks in the US who hold most of the world’s derivatives, would need to crystallise a provision for losses on payout of its debt derivative contracts, thereby decimating their already unacceptably low capital adequacy ratios in terms of BIS guidelines; which will probably render them bankrupt. In turn, banking institutions that thought they had insurance, and that now discover that they don’t, will also have to provide for bad debts, and their capital adequacy ratios would fall to unacceptably low levels; and many of those banks would be bankrupted. The logical end result will be a total – and overnight – collapse of the world’s financial system. The probability of this happening voluntarily is zero, and if some cockamamie rationale were to be put forward that an “agreement” had been reached that Greece’s withdrawal from the EU would not require a provision for bad debts equivalent to 100% of its sovereign debt, then this would be such an affront to common sense (and in such flagrant disregard of GAAP) that confidence in the financial system would be shattered . Therefore, Greece cannot be allowed to withdraw until after “firewalls” have been put in place. Therefore, those who have bought gold for “speculative” reasons, in anticipation of a European break-up, are unlikely to see their anticipated “rocket ship to the stars” profits in the short term.
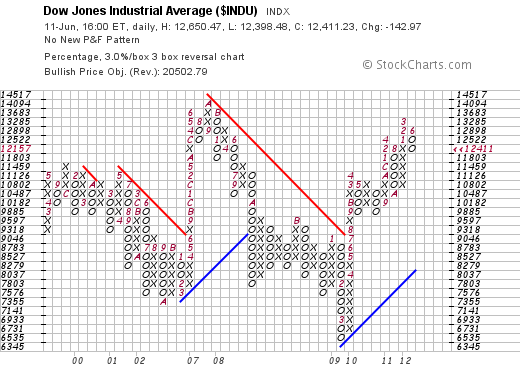
Interestingly, whilst the US equity market undoubtedly gave a Dow Theory, Primary Bear sell signal a couple of weeks ago, the 3% X 3 box reversal Point & Figure Chart below has not yet given a sell signal. Further, if it does, the measured move target will be around the 10,000 level (9,815 – 10,182) – which would not be catastrophic.

So what is the market seeing? How can we work our way out of the apparently insoluble mess? Stay tuned. The opportunity to be discussed in my second article of the trilogy on US Deflation vs EU Inflation may sound like a long-odds bet, but it does seem to have legs; and whilst “time” will be the enemy of this particular opportunity, capitalising on the opportunity itself will take the world economy a step in the right direction.
Author, Beyond Neanderthal and The Last Finesse
Beyond Neanderthal and The Last Finesse are now available to purchase in e-book format, at under US$10 a copy, via almost 60 web based book retailers across the globe. In addition to Kindle, the entertaining, easy-to-read fact based adventure novels may also be downloaded on Kindle for PC, iPhone, iPod Touch, Blackberry, Nook, iPad and Adobe Digital Editions. Together, these two books offer a holistic right brain/left brain view of the current human condition, and of possibilities for a more positive future for humanity.
Copyright © 2012 Brian Bloom - All Rights Reserved
Disclaimer: The above is a matter of opinion provided for general information purposes only and is not intended as investment advice. Information and analysis above are derived from sources and utilising methods believed to be reliable, but we cannot accept responsibility for any losses you may incur as a result of this analysis. Individuals should consult with their personal financial advisors.
Brian Bloom Archive |
© 2005-2022 http://www.MarketOracle.co.uk - The Market Oracle is a FREE Daily Financial Markets Analysis & Forecasting online publication.
Comments
|
khen
13 Jun 12, 13:30 |
gold
Good report, but the point figure Dow chart has a 20000 price objective. If the Dow goes to 20000, I don't think gold will see 1100. khen |


