


Understanding Implied Volatility When Trading Options – Part 1
InvestorEducation / Options & Warrants Jun 11, 2012 - 01:06 PM GMTBy: J_W_Jones

 We have recently discussed the importance of routinely considering the value of implied volatility in a historical perspective for each underlying before considering any of the various option positions potentially appropriate for trading a given underlying security, index, or ETF. Failure to consider this data represents a major cause of the failure of otherwise favorable option positions.
That is not the end of the story with implied volatility and understanding “the rest of the story” can give a trader a substantial edge in selecting and designing options trades. It is important to remember that implied volatility is not some vague theoretical value; it is derived from the actual market prices at which options trade.
From a mathematical viewpoint, implied volatility is the number required to be entered in one of the various options pricing models in order to arrive at the current market price of the individual option under consideration.
Since this is a moment-to-moment empirically derived value, it is very dynamic and is reflective of the aggregate traders’ viewpoints of the magnitude of future price variations. Certain reproducible patterns are routinely observed in the variations of this value.
Three recurring patterns are extremely critical to recognize as an options trader. The first is the increase in implied volatility prior to known events that can reasonably be expected to impact price of the underlying. Specific events would include things such as earnings releases and, in the case of biotechnology companies, FDA decisions impacting various devices or drugs.
Knowledgeable options traders routinely anticipate earnings releases and the run up in implied volatility prior to the event. This volatility typically collapses immediately following an earnings release and negatively impacts traders foolhardy enough to have positions consisting of entirely “long premium.”
The second tendency is for implied volatility to revert to its historic mean. Each underlying has a typical range of implied volatility that is reflective of its individual “personality”. For example, the personality reflected in the implied volatility of XOM is quite different from that of GOOG.
The third pattern is that of seasonality. Implied volatility typically contracts during the summer months as trading volume and large price moves are generally not likely. The only large price fluctuations are likely to participate in the Hampton vacations of Wall Street traders.
None of these three characteristic tendencies is graven in stone, and each is subject to the most expensive five words a trader can utter, “This time it is different.” These are historical tendencies that can be overwhelmed by the specifics of a given situation.
But these personality characteristics of implied volatility are not the main point I want to discuss over the course of my next few articles. The often overlooked characteristic of implied volatility is its usefulness in predicting the magnitude of future price volatility over a variety of time frames.
We first need to do a bit of review of some basic statistical concepts; stay with me, I promise there is a reason to understand this seemingly arcane material. It is necessary to understand the basics of the nuanced language in which the implied volatility speaks. In order to do so, we need to review some fundamental statistical concepts in order to be able to understand what implied volatility is telling us.
Prices of underlying assets can be considered to lie along the path of the familiar “bell shaped curve.” This is familiar to all students of statistics and is variously referred to as a “log normal” distribution or a “Gaussian” distribution of prices.
The curve below represents the theoretical distribution of price of a stock. Individual prices cluster around the mean and as they become more distant from the mean value, the individual prices occur at an ever decreasing frequency.
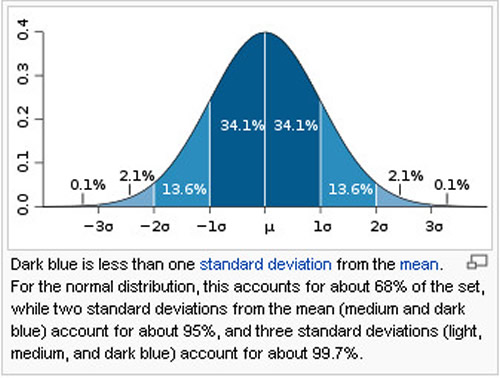
As indicated on the legend of the graph, the standard deviation (SD) measures how broad the distribution width is; a small SD reflects a very “tight” distribution width while a large SD reflects a broad distribution width of prices.
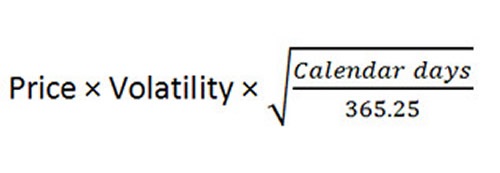
The usefulness of being familiar with this pattern is that the implied volatility can easily be converted to the SD for any given stock. The formula is: 1 SD= implied volatility x stock price. This formula gives the annualized standard deviation and can readily be converted to the SD for the period under consideration by the following formula:
Since the Standard Deviation defines the portion of price variation within a given range, the probability of success of a trade that has a broad range of profitability can be easily calculated. In my next missive, we will look at some real world examples of the utility of this calculation.
 If you are looking for a simple one trade per week trading style then be sure to join www.OptionsTradingSignals.com today with our 14 Day Trial.
J.W. Jones is an independent options trader using multiple forms of analysis to guide his option trading strategies. Jones has an extensive background in portfolio analysis and analytics as well as risk analysis. J.W. strives to reach traders that are missing opportunities trading options and commits to writing content which is not only educational, but entertaining as well. Regular readers will develop the knowledge and skills to trade options competently over time. Jones focuses on writing spreads in situations where risk is clearly defined and high potential returns can be realized.
This article is intended solely for information purposes. The opinions are those of the author only. Please conduct further research and consult your financial advisor before making any investment/trading decision. No responsibility can be accepted for losses that may result as a consequence of trading on the basis of this analysis.
© 2005-2022 http://www.MarketOracle.co.uk - The Market Oracle is a FREE Daily Financial Markets Analysis & Forecasting online publication.