Debt Deflation, Corporate Efficiency and Stock Prices
Stock-Markets / Deflation Jun 09, 2012 - 04:09 AM GMT It all started out great in 1949. The global economy had finished deleveraging from the great depression. The austerity of the long wave cycle winter season had burned off the results of earlier decades of debt buildup, overproduction, and economic excess. Bad debt had failed and been written off. The global long wave cycle of boom and bust had ended. On a 20-year compounded annual rate of return inflation adjusted stock prices bottomed in 1949. A broad global economic spring season had begun in earnest.
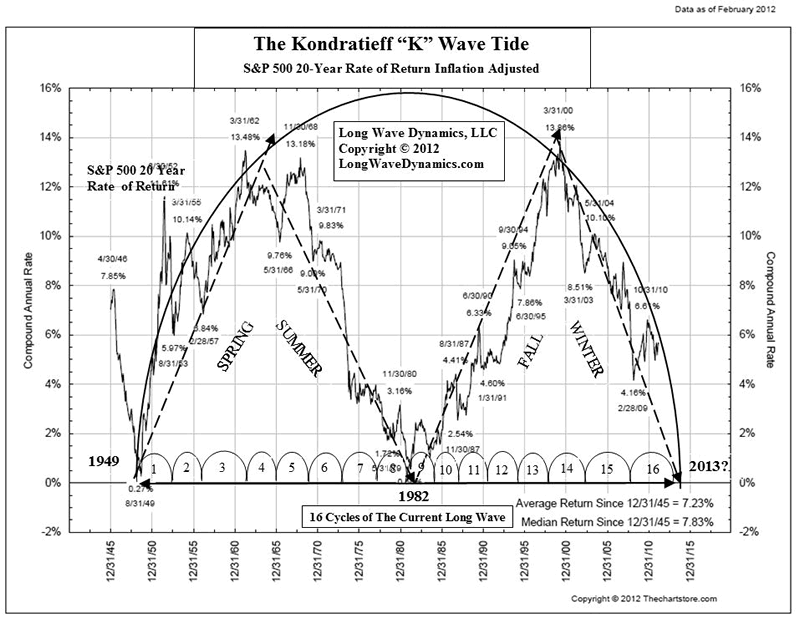
In 1949 the private economy had deleveraged and was embarking on a new long wave spring season and boom. Economic demand was expanding. Times were good, jobs were available, and global demand was increasing at a good clip. Large swaths of capitalism lost to communism, but global expansion was underway. The good times rolled on in the long wave spring of the 1950s and into the mid 1960s. The long wave summer of inflation in the 1970s was a little rough, killing profits and stock prices. The fall season in the 1980s and 1990s saw debt and corporate efficiency increase, stocks boomed. It was a great long wave ride. However, in the late 1990s something appears to have gone horribly wrong, as reflected in the 20-year return chart of the S&P 500 (SPX) below.
Fractional reserve banking works wonders as long as the system is expanding, and the private sector is willing to add more debt. New ideas, inventions, innovations, etc. were generating new businesses, new brands, new jobs and new demand. The use of debt leverage expanded corporate margins during the long wave spring season. Debt grows on the back of expanding corporate efficiency that can put new debt to work in a profitable manner with sufficient margins to keep shareholders happy and markets rising. Margins were even good enough to pay the taxman's growing appetite from a growing portion of the pie. Stock prices rose. Unfortunately, this long wave phase of rising corporate efficiency does not go on forever.
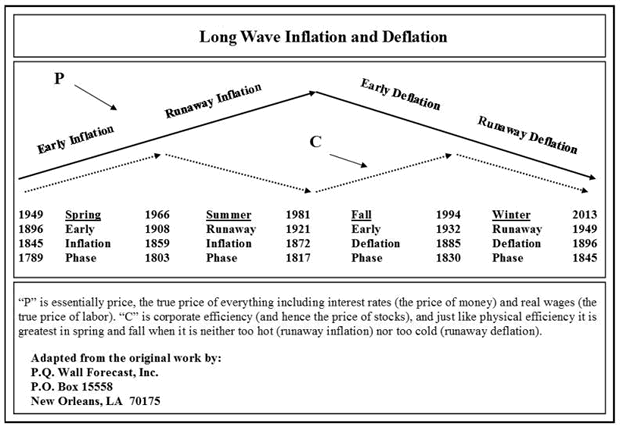
The seasons of the long wave explain the broad impact of corporate efficiency on profits and stock prices. Early inflation in a long wave spring season helps corporate efficiency and profits. Companies can raise prices for their products faster than input costs and prices paid are rising, so profits and stock prices rise. Rapidly rising prices and inflation in the long wave summer hurt efficiency and profits, as prices paid and costs rise faster than prices received, so profits fall along with stock prices. Disinflation and slowly falling prices help corporate efficiency, since input cost and prices paid fall faster than prices received, so profits rise as do stock prices, e.g. the 1920s and the 1990s.
Deflation crushes corporate efficiency and profits, hammering stock prices as prices paid fall slower than prices received, e.g. the 1930s and since the 2000 top. The chart below is adapted from the original by PQ Wall, which depicts the inflationary and deflationary impact on corporate efficiency and in turn corporate inefficiency and therefore stock prices.
The problem is that politicians, government central planners and many capitalists believe business and markets reflect a linear Newtonian world. They actually believe the Keynesian dribble that mechanical cause and effect is how the economy and markets work. They extrapolate into a future that is a farce. The future they forecast will never exist.
The problem is that Newtonian mechanics no longer fully explain the physical world. Cause and effect thinking and linear math will hand your head to you in economics, government budgets and financial markets. Fields of human action that unfold as large and small cycles of boom and busts are the real deal. Only cycles explain the real world of global markets.
There comes a point in the global long wave boom and bust cycle when the math simply no longer works on the debt levels. Total global debt passes the point where incremental debt can deliver growth in profits. In an attempt to save the old economy of a dying long wave cycle boom, governments and central banks have leveraged the global economy even deeper into debt.
The fractional reserve multiplier of central banks and leveraged governments, corporate and individual balance sheets, is now working in reverse. This triggers debt deflation, hurts corporate efficiency, and hammers stock prices. The world is in an accelerating long wave debt-deflation bust. This makes corporate operations inefficient. This eventually drives profits and therefore stock prices lower. The final leg of long wave debt deflation is unfolding globally.
Cycles are fields of human action. Anyone that cares to observe the real world rise and fall of business and market cycles, large and small, will recognize that cyclical fields of human action are a more practical paradigm for explaining the economy and markets. Linear math, like linear thinking, builds up unsustainable debt, forces demand to recoil when system participants cannot pay the debt bill, and takes the system over the edge of a debt cliff. Today the world has so much debt it is triggering a demand shock. A psychological component is also producing revulsion of more debt and deleveraging is in vogue.
When the whole system downshifts, and then shifts into reverse, as is occurring at present, the fractional reserve system that counts on incremental inflation to cover its shortcomings turns to deflation. The private sector is refusing more debt. The velocity of money is crashing. The debt deleveraging triggers deflation. The risk-off trade stays off too long. Deflation begins to corrode the financial foundations. Debt collapse ensues.
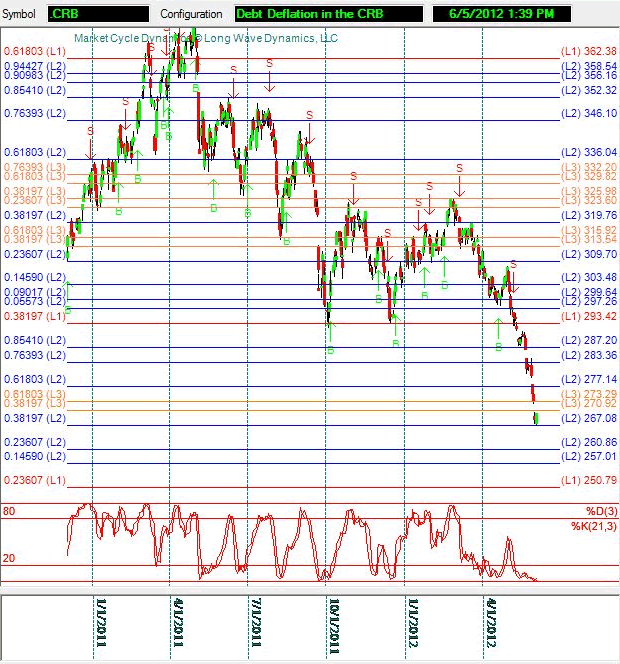
The debt deflation phase of the long wave winter season began in Japan years ago, but is clearly entering a new phase of destructive deflation in commodities and other real assets. The debts are coming due, and everything not nailed down, in grain elevators, feedlots and oil storage tanks, is being sold in fear of deflation, and to meet margin calls of all types.
The recent drop in the CRB through the Level 1 inverse golden 38.2% target signifies the global economy is entering a new and dangerous phase of debt deflation. The chart does not depict linear math of government and central bank managed economic growth. It more accurately reflects the shocking real world observation of debt deflation and commodity price collapse, a glimpse of quantum field wave collapse in high finance and pork bellies. The swan dive in the CRB is terrifying the central bankers, as it threatens to undermine the value of all the debt they have been creating. If you have never seen a Fibonacci drill-down grid, the one below will make you realize you have not been seeing what the market is actually up to, or down to. .
Energy prices are a key component of almost all business costs. Energy represents various percentages of total product costs. Shippers are getting better at passing a portion of direct energy costs on to customers. In short, energy is a big piece of the corporate efficiency story due to the impact on product and delivery prices, but the impact of energy on prices goes even deeper. Energy is a very high profile component of business. When energy prices are falling, it becomes more difficult to pass any price increase on to customers.
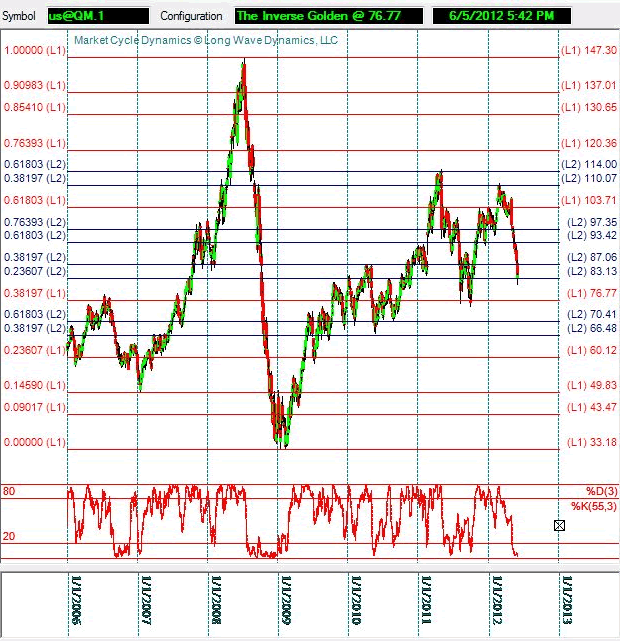
The chart below reveals NYMEX Oil closing in on the Level 1 Fibonacci 38.2% target at $76.77 a barrel. If this support does not hold, it will likely trigger a collapse in oil to the 2009 low of 33.18. That fall in energy prices will trigger a deflationary feedback loop into the global economy that will accelerate the long wave debt deflation. This could drive oil below that 33.18 low into the bottom of this K wave cycle in 2013, along with a wave of corporate inefficiency.
Falling energy prices affect corporate efficiency in a number of ways. They reduce costs and put more cash in consumer pockets as the price of gas goes down, but they make it more difficult to raise prices on all goods and services. Falling energy prices increases the odds that consumers want a deal on all other purchases. Rising profits require greater volume or expanding margins. Falling prices, especially due to debt deflation, also reduces volumes and reduces margins, producing corporate inefficiency in a long wave winter season. This is the reverse of corporate efficiency where rising prices and sales volumes expand gross margins and profits in a long wave spring season.
This is where it gets interesting. On the surface, falling energy prices are a positive development for businesses and customers. When all prices are rising, businesses can more easily get away with raising their prices and passing raising costs onto consumers. The problem is that in hard times consumers get increasingly well informed about the prices they pay for everything. As the debt cycle peaks, debt payments are absorbing a growing amount of global income. Cash is king, and as a debt deflation gets underway, customers do not have as much cash, putting downward pressure on prices they are willing to pay.
Customers recognize inflation and deflation and are more price sensitive than forecasters realize. Customers realize energy prices are declining and want to get their share of energy savings on everything, and not just gas at the pump. They want to see prices falling. This is where it gets dangerous, as customers stop buying, waiting for prices to fall. This reinforces the deflationary feedback loop, accelerating the deflation. Investors sell stocks as they expect corporate inefficiency.
An inflation-adjusted chart of the S&P 500 since the beginning of the current long wave cycle in 1949 demonstrates the long wave spring and fall seasons of corporate efficiency and long wave summer and winter seasons of inefficiency. Removing the inflationary and deflationary distortions, stocks have clearly been declining since the 2000 top, as investors recognize corporate inefficiency of debt deflation and sell their stocks.
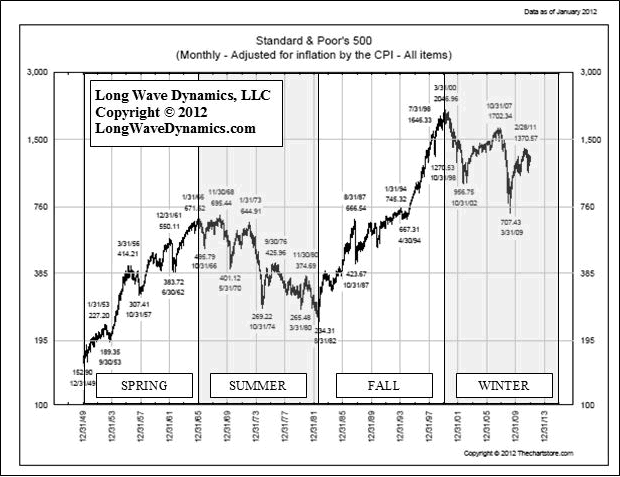
Deflation is a paradox. Mr. Market knows rising prices are required for profits, and offers discounts in an attempt to get to the rising prices on the other side of the deflationary valley. If the depth of the valley is miscalculated, the bottom falls out, and it produces a deflationary spiral. Japan has been in one for more than 20 years and the U.S. is now being pulled into the same debt deflation contraction.
Debt deflation, corporate efficiency and stock prices are driving the current long wave. What is not clear is to what degree the central banks have or will miscalculate the depth of the upcoming debt deflation valley in this business cycle. Past and future central bank intervention has and will only buy time in the debt deflation decline of this business cycle. The final descent of this long wave winter season will be swift and deep.
Cheap fuel for Chairman Bernanke's helicopter provides deep irony in the unfolding debt deflation paradox. The path of least resistance for prices is now down, and a debt deflation driven collapse in prices is in play.
In the short term, a solid Wall cycle rally is expected, but the global price drop will hammer corporate efficiency, and stock prices will follow corporate efficiency down into a long wave bottom in 2013. This final leg down will set the stage for a new long wave spring season of rising demand and prices, driving a new era of global corporate efficiency. Global franchise large caps will flourish and investors and traders can ride the profit and stock price wave in the coming long wave spring season.
In short, keep some powder dry to ride the K Wave cycle up from the coming debt deflation and corporate inefficiency driven global stock price bottom. Put another way, in the words of the good reverend Tony Campolo, "It's Friday, but Sunday's coming".
David Knox Barker is a long wave analyst, technical market analyst, world-systems analyst and author of Jubilee on Wall Street; An Optimistic Look at the Global Financial Crash, Updated and Expanded Edition (2009). He is the founder of LongWaveDynamics.com, and the publisher and editor of The Long Wave Dynamics Letter and the LWD Weekly Update Blog. Barker has studied and researched the Kondratieff long wave “Jubilee” cycle for over 25 years. He is one of the world’s foremost experts on the economic long wave. Barker was also founder and CEO for ten years from 1997 to 2007 of a successful life sciences research and marketing services company, serving a majority of the top 20 global life science companies. Barker holds a bachelor’s degree in finance and a master’s degree in political science. He enjoys reading, running and discussing big ideas with family and friends.
© 2012 Copyright David Knox Barker - All Rights Reserved Disclaimer: The above is a matter of opinion provided for general information purposes only and is not intended as investment advice. Information and analysis above are derived from sources and utilising methods believed to be reliable, but we cannot accept responsibility for any losses you may incur as a result of this analysis. Individuals should consult with their personal financial advisors.
© 2005-2022 http://www.MarketOracle.co.uk - The Market Oracle is a FREE Daily Financial Markets Analysis & Forecasting online publication.


