


The Wonder Rally is Over, Stock Market Back at Flash Crash Trigger
Stock-Markets / Financial Crash Jun 08, 2012 - 07:09 AM GMT

 -- I have reset the wave count on the VIX to correspond more closely with the Cycle Model. The Trading Cycle high on May 18 occurred on day 63 of the new Master Cycle. Normally, Trading Cycles are 60 days long, so that high meets the parameters. It turned out that today was a pivot day, which signals that VIX is ready to move considerably higher after its pullback. I had expected a Primary Cycle to top out tomorrow but inverted to a low today, instead. Today is day 83 in a normal 86 day Primary Cycle, so it has met its minimum date range. The alternate view is that the Primary Cycle may extend to June 13-14, primarily because of the influence of the Euro. This would definitely have a high probability of a crash scenario. Whether it happens by June 13 or not, the same crash scenario extends to mid-July.
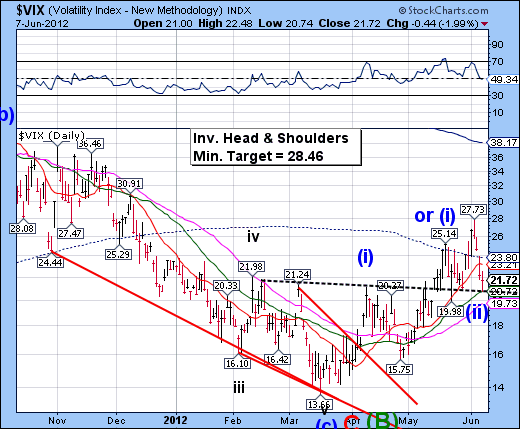
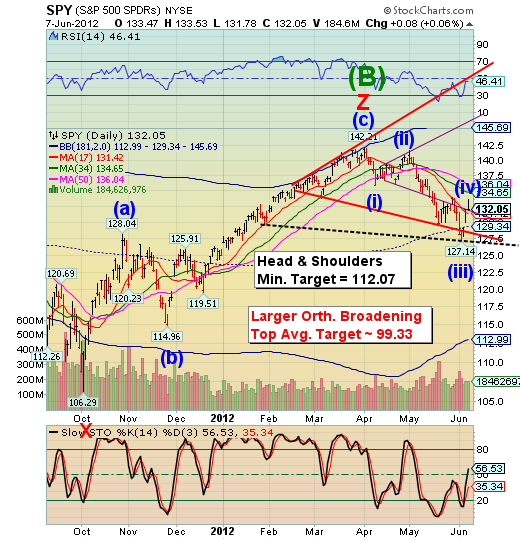
-- The two-day “wonder rally” in SPY lasted exactly 17.2 market hours and ended shortly after Bernanke’s bland presentation. The Orthodox Broadening Top pattern is not nullified. The Head & Shoulders neckline and minimum target has been adjusted down to the daily Cycle Bottom support, so I suggest that will be the location of the next bounce. We’ll monitor the speed of the decline, since it may introduce yet another Head & Shoulders pattern at the lower bounce. It appears very likely. The wave count is the simplest and most straightforward, given that the Trading Cycle may be extending. I’ll adjust it as changes dictate.
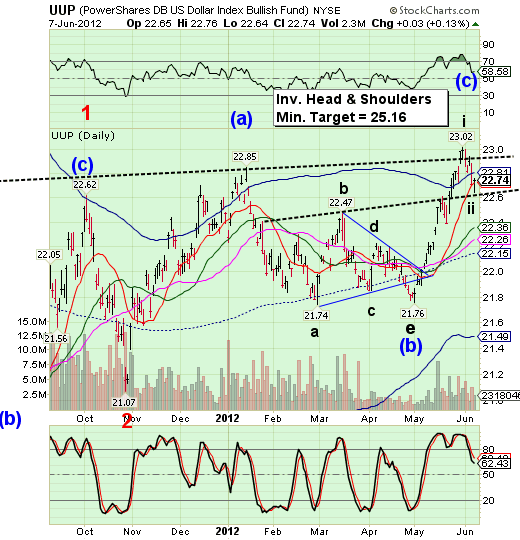
--I noticed a “failed” Head & Shoulders neckline whose target was 23.16-23.20. I call it “failed” because UUP did not meet its customary target. An interesting point of reference is that 82% of all complex Head & Shoulders bottoms meet or exceed their targets. In today’s case it acted as support for the retracement low today at 22.64. The correction appears to be over as UUP also made a pivot low and closed just above short-term support at 22.72. You may remember that as the first Head & Shoulders target off the May 2 low.
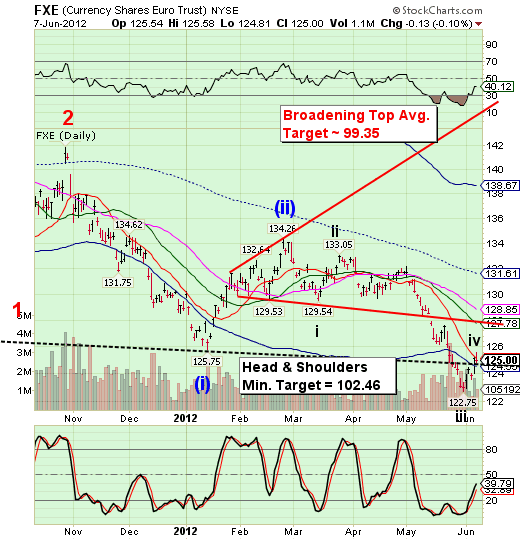
-- FXE closed above its Head & Shoulders neckline at 124.75 but below short-term trend resistance at 125.13. Yesterday’s and today’s run on the shorts only resulted in a very weak 27.5% retracement. The next waterfall decline is due to start momentarily. FXE’s oversold condition is now neutralized. The next major pivot low is now due between June 14-18, which may bring FXE to parity by then. Remember, once the Crash Trigger is activated, the decline may turn into a Flash Crash at any moment. An alternate view is a possible decline to 120.50, then a final retest of the neckline before selling off.
(ZeroHedge) …The next few weeks consist of some crucial events - perhaps most notably the EU summit of 28-29 June - which create scope for governments to offer fundamental responses to the Euro crisis. Goldman Sachs, like us, expects to be disappointed and are not optimistic that resolution will be achieved in the near-term.
For a clear explanation of the proposed European Banking Union (non-solution), read this.
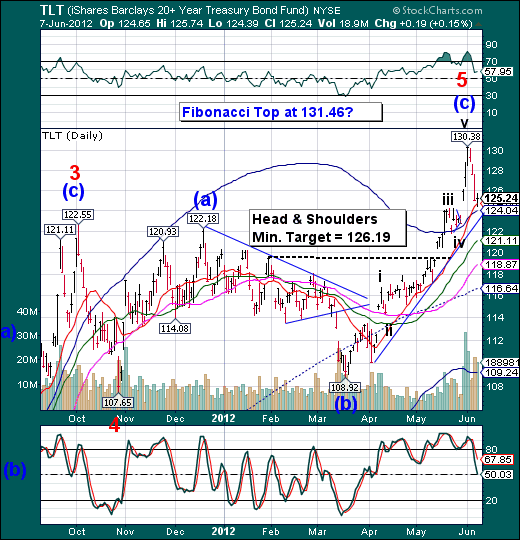
-- The call to exit TLT last Friday has been given confirmation in Elliott Wave International’s special edition of its Theorist yesterday by calling it The Top. This is making me a little nervous since I expect to see a bounce into Monday or Tuesday as stocks sell off and frankly cannot determine whether it may make yet another new high. The fact that TLT found support at short-term trend support rather than the trendline suggests the probability of yet another high in an Ending Diagonal formation. I am neutral, pending a reversal pattern on which we can hang a sell signal or go higher.
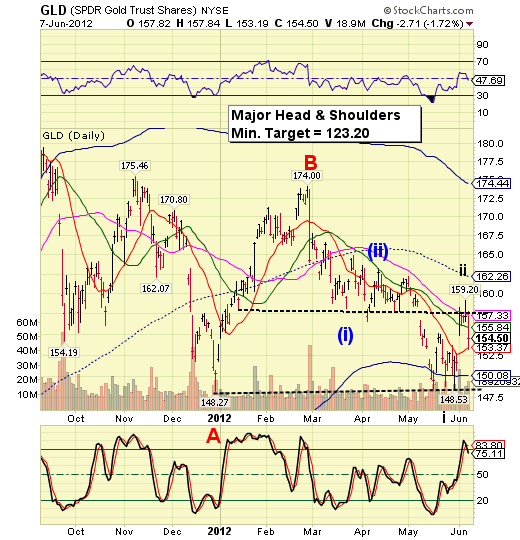
-- GLD fell away from its upper Head & Shoulders neckline after making a steep 72.7% retracement of its last impulse. It closed beneath its 50-day moving average at 157.65, which is not a good sign for an overbought ETF. GLD has less than two weeks to decline into a Primary Cycle [wave (iii)] low expecting a bottom in mid-June.
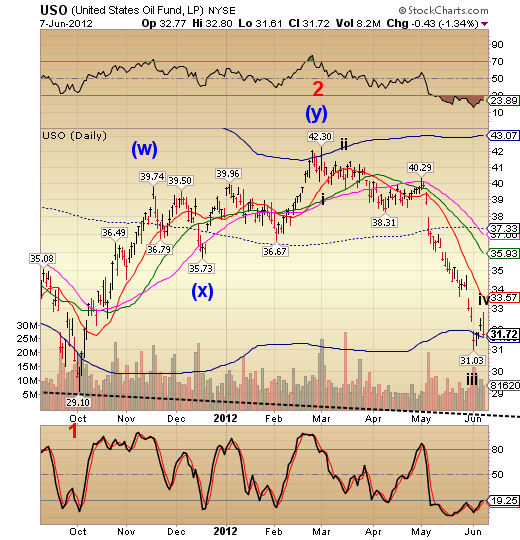
-- USO closed just above Cycle Bottom support at 31.59. USO may have only finished wave iv of (i) of 3, so it appears that there is one probe deeper to complete the Master Cycle low due between June 13-18. There is a massive Head & Shoulders neckline near 28.00 in the weekly chart which may halve the price of oil in wave (iii). I’ll address that issue when we get closer to the neckline. For now it appears that the target for the final probe deeper may be 28.00.
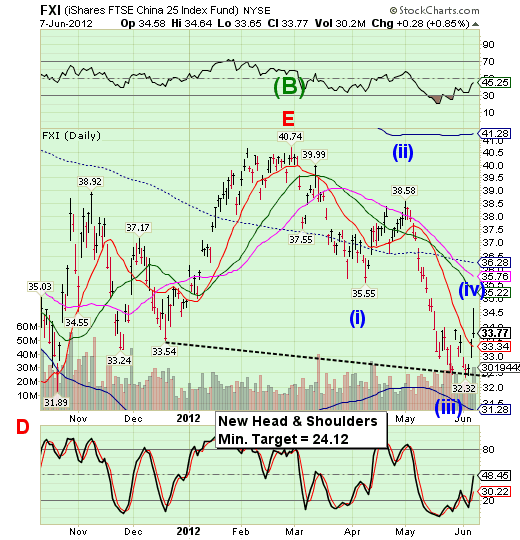
-- FXI very nearly made a Fibonacci 38.2% retracement (37.4%) in this rally. The Cycles Model suggests that we may see the decline resume through the second week of June (13-18), when a Master Cycle low is due. Generally, wave threes which are broad and deep are announced by Head & Shoulder patterns. This neckline announces a potential wave (v) of 1, so the target is a bit suspect, unless there is a crash.
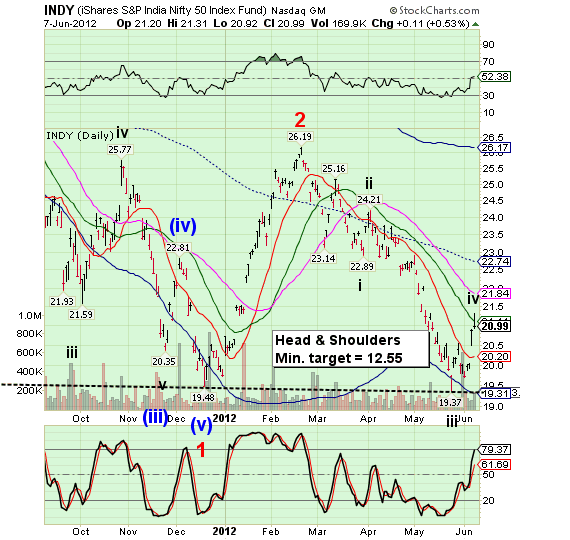
-- INDY is now preparing to break the massive Head & Shoulders neckline below 19.37. It is due for a Master Cycle low in mid-June (same as GLD and FXI), so rather than fulfilling the Head & Shoulders minimum target, wave relationships suggest that a near-term target for wave v of (i) of 3 might be close to 18.26. This Head & Shoulders patterns may be launched from the underside of the neckline, which may make it a monster pattern unfolding in wave (iii).
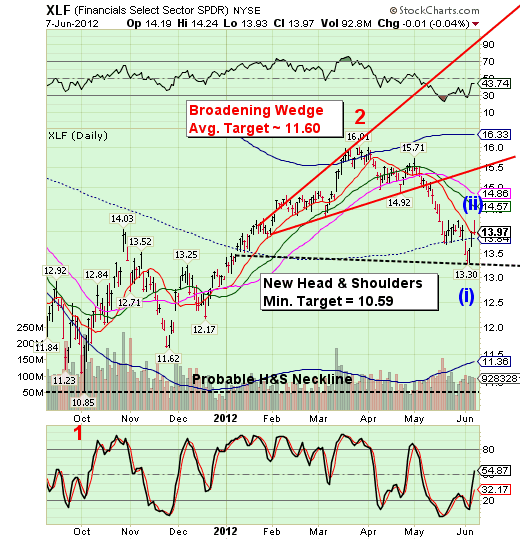
I lowered the Head & Shoulders neckline for XLF to 13.30 to fit the completed pattern that is now evident. It appears that the Master Cycle low came early in this ETF. The current decline should take XLF beneath its October low and possibly to the massive “probable” neckline at the bottom of the chart at 10.85. It appears now that XLF shares the “liquidity cycle” with other ETFs that are being followed in this report.
(ZeroHedge) In today’s world, there are many who want government to regulate and control everything. The most bizarre instance, though — more bizarre even than banning the sale of large-sized sugary drinks — is surely central banking.
Good luck and good trading!
Tony
Our Investment Advisor Registration is on the Web
We are in the process of updating our website at www.thepracticalinvestor.com to have more information on our services. Log on and click on Advisor Registration to get more details.
If you are a client or wish to become one, please make an appointment to discuss our investment strategies by calling Connie or Tony at (517) 699-1554, ext 10 or 11. Or e-mail us at tpi@thepracticalinvestor.com .
Anthony M. Cherniawski, President and CIO http://www.thepracticalinvestor.com
As a State Registered Investment Advisor, The Practical Investor (TPI) manages private client investment portfolios using a proprietary investment strategy created by Chief Investment Officer Tony Cherniawski. Throughout 2000-01, when many investors felt the pain of double digit market losses, TPI successfully navigated the choppy investment waters, creating a profit for our private investment clients. With a focus on preserving assets and capitalizing on opportunities, TPI clients benefited greatly from the TPI strategies, allowing them to stay on track with their life goals
Disclaimer: The content in this article is written for educational and informational purposes only. There is no offer or recommendation to buy or sell any security and no information contained here should be interpreted or construed as investment advice. Do you own due diligence as the information in this article is the opinion of Anthony M. Cherniawski and subject to change without notice.
Anthony M. Cherniawski Archive |
© 2005-2022 http://www.MarketOracle.co.uk - The Market Oracle is a FREE Daily Financial Markets Analysis & Forecasting online publication.