


Stocks Bear Market Focus Point: Diary of a Market Top
Stock-Markets / Stocks Bear Market Jun 04, 2012 - 01:08 AM GMTBy: Garry_Abeshouse

 US share indices have been until recently sitting at highs not seen since 2007/2008, while the world was and still is experiencing an economic meltdown with no end in sight. Where did the bulls think the market would go to from these levels? What were they thinking – that we live in a world where the law of gravity can be defied and bull markets will keep on rising forever? What sort of world do they think this is? It is just this type of thinking that makes Bull traps what they are – traps for those that feed off fantasies.
There still appears to be a broadly based belief that the USA will favourably weather the current financial storms, allowing equity markets to rise like Lazarus once again. This US centric view, proclaimed with an almost religious like fervour by some, will not be enough for a market resurrection and a resurgence of the American Dream.
And talking about the American Dream. Over the last twelve months we have seen a significant blowout in equities sparked more or less by the euphoria of one single stock – Apple. And more recently, what better way to confirm an equity market Bull trap than a multi-billion dollar new listing gone wrong as Facebook shares dive from a high of $45 to a low of $27, just a few days after listing. Another fantasy goes bust for some investors.
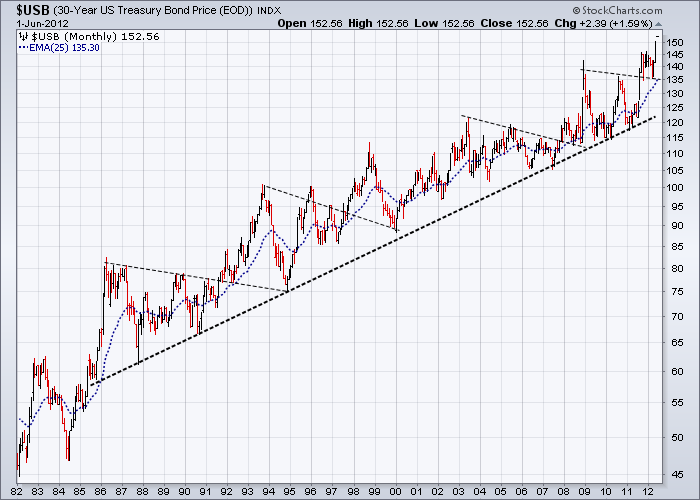
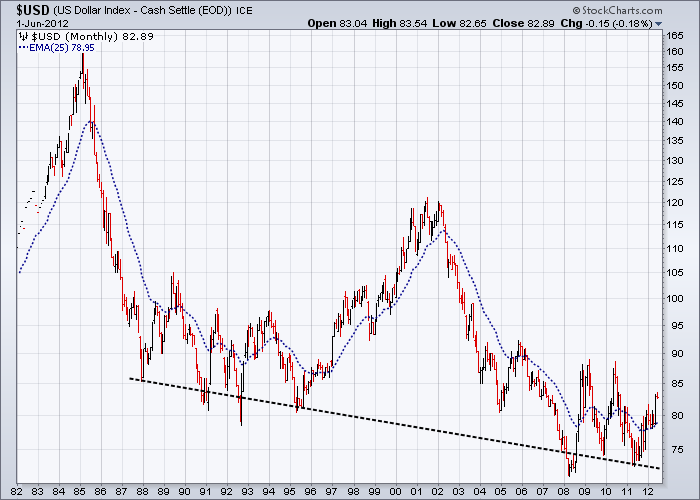
But despite these attempts to misinform and mislead, the American spin-doctors will probably be half right – at least for a time. I expect the love hate relationship with a rising USD to continue for some time to come. In fact since 1982, as you can see from the 30yr T-Bond monthly chart below, risk-off investors appear to have maintained a certain taste for US T-Bonds, despite the ever decreasing yields over this time and a USD that fluctuated wildly. You can also see that since 1988, the USD has been essentially building a long term base. There is a clear uptrend on the 30yr T-Bond chart that clearly starts prior to this time and continues uninterrupted to the present day. In fact as you can readily see, the rise in 30yr T-Bonds prices has even accelerated over the last few weeks as money moves out of non-US currencies, equities and commodities.
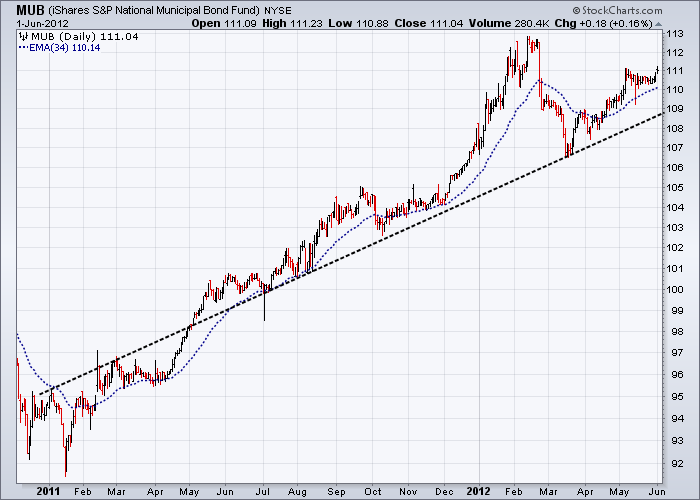
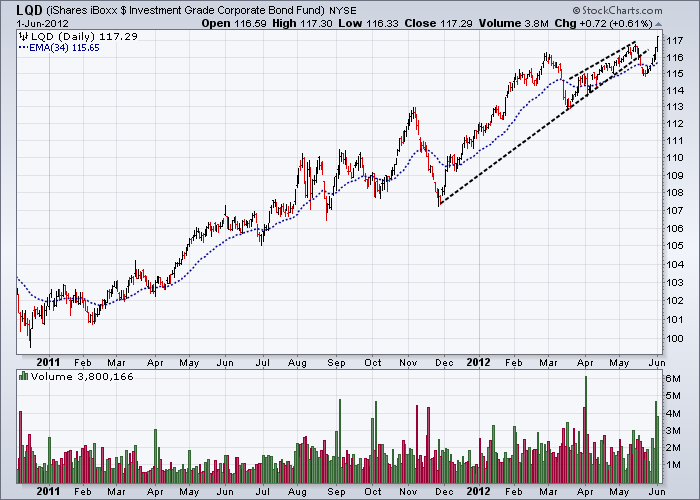
This move into US T-bonds has also been accompanied by continued strength in better quality US Corporate and Municipal Bonds. But it is the strength of the latter, that reinforces my view that in the USA and much of the institutional investment community – that spin is still king. This spin is being used to continually reinforce their parochial view that the bottom is not far away and that those pesky Europeans are really not that important anyway. It is far easier for the US media to comment ad nauseum on the minutiae of Romneyisms and use the Blame Game, rather than ponder on the more important issues of the day. As Noam Chomsky is probably still saying as he did way back in 1967 - Where are the responsible intellectuals when you need them?
There are none so blind as those who will not see.
In this age of instantaneous markets, electronic multimedia and saturation statistics, it continues to both astonish and overwhelm the mind as to why financial markets continue to display chart patterns, much as they always have done. Tops are still tops and they appear to be ignored just as often as they always were. Head and shoulder and other top patterns now litter the charting landscape not only in the USA, but also across the world.
But one prominent Technical Analyst, ignoring the plethora of tops in his own market, places blame firmly in the hands of the world outside the USA by announcing:
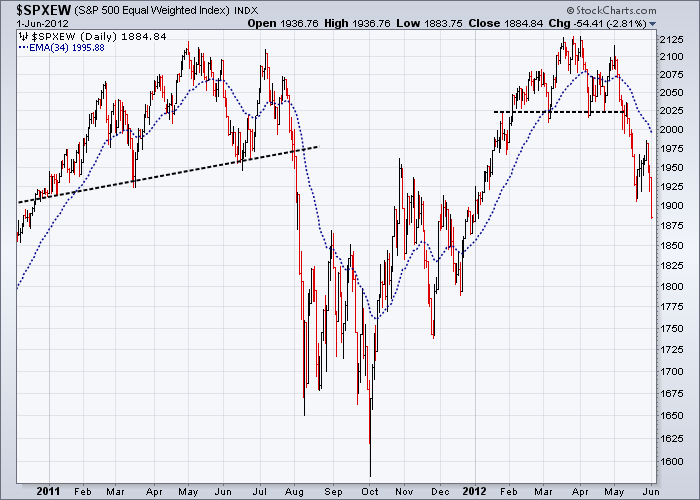
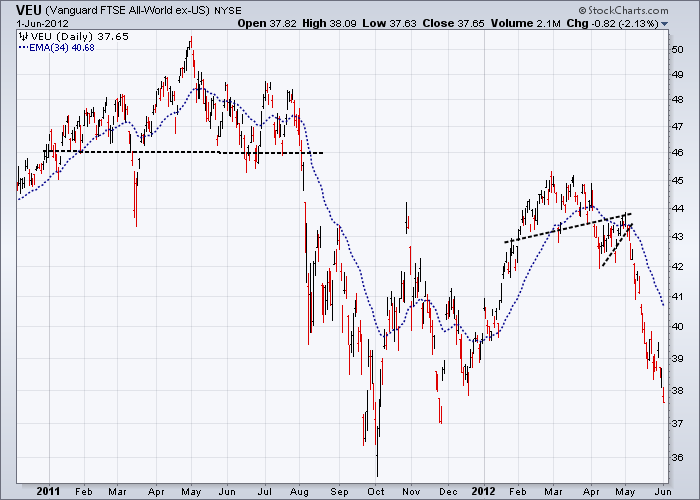
“FOREIGN HEAD AND SHOULDER TOP... I wrote about the possibility that foreign stocks were forming a "head and shoulder" top a couple of weeks ago. But I believe it bears repeating. That possibility really worries me. Judge for yourself. . . . Either way, the pattern (in the Vanguard FTSE All World ex-USA ETF) scares me. If foreign stocks are in fact tracing out a major top, there's no way U.S. stocks will escape more serious damage. They may not fall as far, but they will fall some more.” Obviously he has not seen the breakdown from the well-formed top on the S&P 500 Equal Weighted Index I have reproduced below as well as the other tops I have not shown.
The across the board weakness in financial markets also makes a mockery of much of the way the financial media and economists have covered market events over the last twelve months. Checking the starting dates of market turning points over the last twelve months, also illustrates beautifully how the high volume traders decide their up and coming strategies and make major trading decisions at the end and/or beginning of each calendar month, seemingly ignoring much of the froth and bubble of what may be loosely called financial reporting.
In the year 2011, there were warnings . . . . .
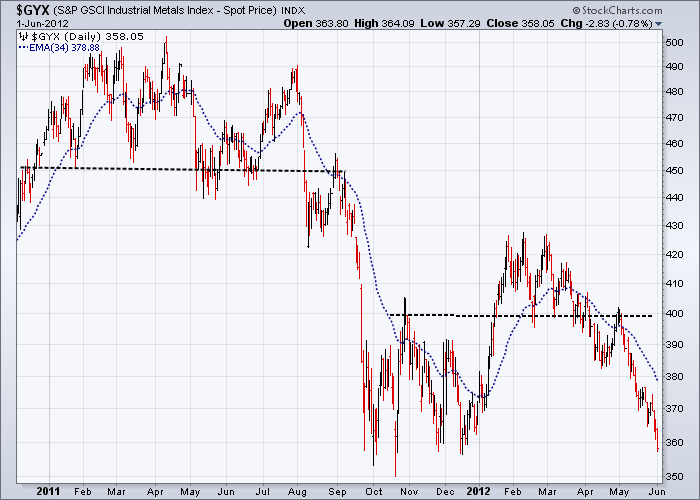
The first signs that financial markets had begun a process of topping out were shown when Copper and Palladium futures peaked in February 2011. These events were quickly followed by peaks in the Industrial metals Spot Index ($GYX) and the Reuters CRB Commodity Indices in March, while Silver and the various Oil prices followed in April.
On May 1st 2011, as the Euro saw 1.492 for the last time, both the Large Cap S&P500 Equal weighted Index and the Mid Cap S&P 400 Index peaked in the “head” portion of a seven month H&SH top that fell through the neckline on August 1st 2011.
By October 4th 2011 the S&P500 Equal weighted Index had bottomed at 1584, before rising to peak again at between March 27th and April 2nd 2012 at 2129 – just a smidgen above the May 2011 peak.
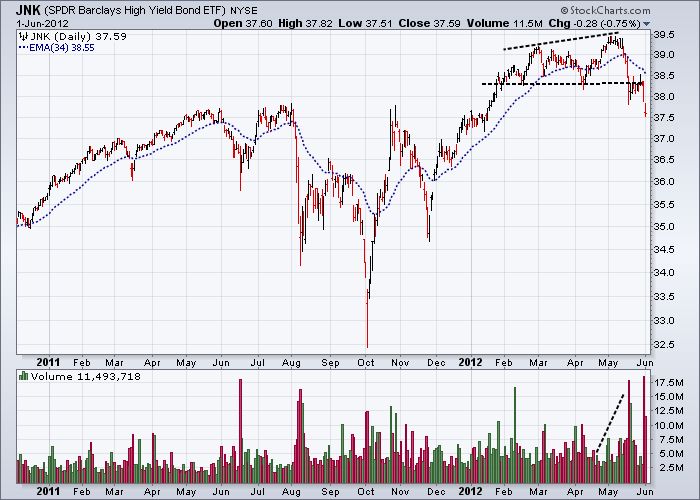
Even the Junk Bonds started topping out on February 29th 2012 and have now turned sour as they break down from confirmed tops along with the equities. It will not be long before they are followed by other corporate and municipal bonds.
And in 2012 it’s déjà vu – 2008 and 2011 all over again, where the strongest of the weak shall be king.
We now move forward to February 7th 2012 at 10:53:48 pm central European time and the moon, although hidden by ominous clouds heralding the storm that was yet to come, had just become full. From this day on, like a cascade of dominos, the most heavily traded currencies proceeded to fall from grace against the USD, one by one. From this day on, almost as if programmed, the USD Index bottomed at 78.5 and proceeded to extend a base that started in early 1988, before moving up to where it is now at 82.89. Right from the start, the USD and US treasuries have dominated the risk-off trade, which in itself says a great deal about the depth of underlying bearishness in peoples psyche and more about which side of the market many of the high volume traders see future profits.
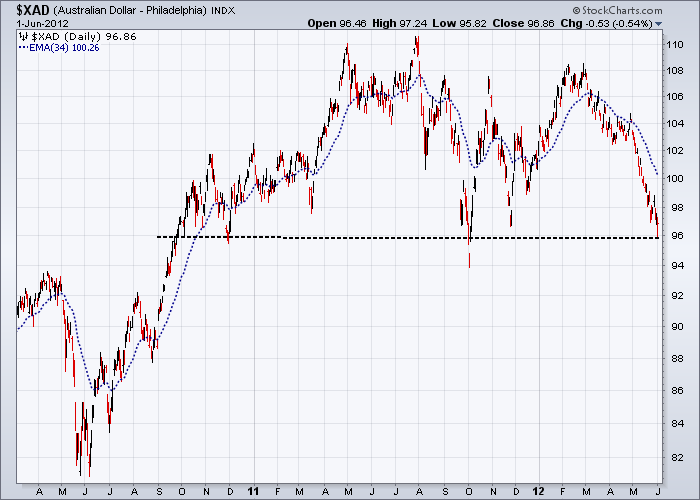
First cab off the bearish rank in 2012 was the Japanese yen at 1.3133 on January 31st, next on February 8th was the AUD peaking at 1.0845, then on February 24th the Euro peaked at 1.348, on April 30th the British Pound peaked at 1.6300 and on May 1st the Canadian dollar peaked at 1.017.
We now retreat back a little to March 20th. On the previous Thursday, Apple shares had had risen to break $600 for the first time and the big traders were sitting around their large mahogany tables at their usual morning meetings mulling over the coming day’s business. This was also the day when the Comex Nasdaq 100 eMini peaked at around 2788, even though the actual Nasdaq 100 Index continued to rise until peaking at 2794 on Wednesday March 28th 2012 .
Then true to form on the first trading day of May 2012, exactly one year after reaching the May 2011 peak, the large traders again decided that it was time out and proceeded to sell the market down.
It is now early June 2012 . . . and the rout in currencies, commodities and equities continues with many entities, already testing their 2011 lows have the 2008/2009 lows now set firmly in their sights.
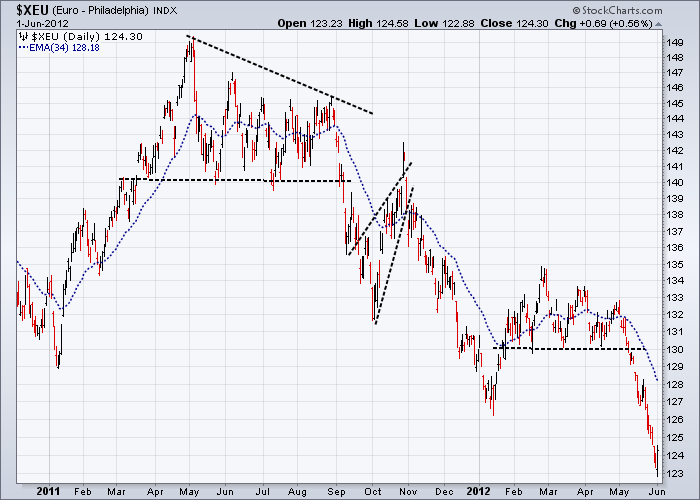
The last word
Germany must be the sacrificial lamb – but it will never happen.
When will the Europeans realise that probably the only partly realistic solution to their mess, is to extricate the Deutschmark from the Euro. This would in theory allow the stimulus effect of a depreciating new euro backed by the weaker European economies to buy them some time. I realise the Germans will never be a party to this, but at some point in the future they just may have no choice. Then again in the more likely scenario, the markets may just decide for themselves and dramatically devalue the Euro against the USD. The dark horse here of course as always is the Chinese Renminbi, which is currently more or less tied to the USD.
In the scenario I propose above, which sees the USD appreciate against most of the world’s currencies, there would be huge pressure placed upon the Chinese to allow the Renminbi to depreciate against the USD along with the other currencies in order to protect their export markets. In fact as you can see below, the bets already placed appear to favour this view.
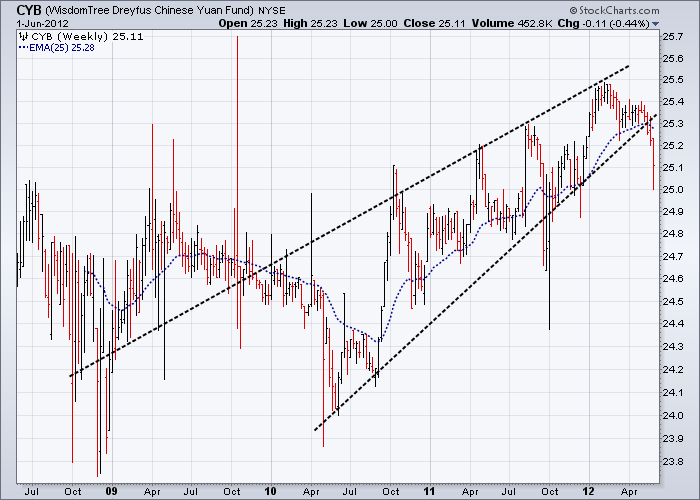
For those like me conflicted by the dual names of the Chinese currency, Wikipedia comes up with a simple definition. “The yuan is the base unit of a number of modern Chinese currencies. The yuan is the primary unit of account of the Renminbi.” Enough said.
Till next time.
Garry Abeshouse
Technical Analyst.
Sydney
Australia
I have been practicing Technical Analysis since 1969, learning the hard way during the Australian Mining Boom. I was Head Chartist with Bain & Co, (now Deutsch Bank) in the mid 1970's and am now working freelance. I am currently writing a series of articles for the international "Your Trading Edge" magazine entitled "Market Cycles and Technical Analysis".
I specialise in medium to long term market strategies.
© Copyright Garry Abeshouse 2012
Disclaimer: The above is a matter of opinion provided for general information purposes only and is not intended as investment advice. Information and analysis above are derived from sources and utilising methods believed to be reliable, but we cannot accept responsibility for any losses you may incur as a result of this analysis. Individuals should consult with their personal financial advisors.
© 2005-2022 http://www.MarketOracle.co.uk - The Market Oracle is a FREE Daily Financial Markets Analysis & Forecasting online publication.