


Stock Market Downtrends Continue
Stock-Markets / Stock Markets 2012 Jun 03, 2012 - 12:19 PM GMTBy: Tony_Caldaro

 After a one week gain, and the possibility of a downtrend low, the markets rallied early but broke down late in the week. Fear of an economic slowdown in the US, in conjunction with economic slowdowns in Asia and Europe, fueled the decline. For the week the SPX/DOW were -2.85%, and the NDX/NAZ were -2.95%. Asia managed only a 0.6% decline, but Europe lost 3.7% and the World index was down 2.7%. On the economic front it was a predominently negative week: 4 positives and 13 negatives. On the uptick: the ADP index, construction spending, the monetary base and auto sales. On the downtick: Case-Shiller, consumer confidence, pending homes sales, Q1 GDP, the Chicago PMI, monthly payrolls, personal income, PCE prices, ISM manufacturing, investor sentiment, the WLEI, and both the unemployment rate plus weekly jobless claims increased. Next week we will get reports on ISM services, consumer credit and the FED’s beige book. Best to your week!
LONG TERM: bull market
During the spring-summer 2011 correction all but 2 of the 20 world indices we follow turned negative with our Smart $$$ indicator. The only two that remained positive were the US and Indonesia. Flash ahead one year, to the spring of 2012, and wouldn’t you know the same two world indices are, as they say, swimming upstream. Naturally, when 90% of the world’s markets are under selling pressure it is hard to stay bullish on the remaining two. But cautiously bullish we remain, at least on the US.
Our wave structure and count from the March 2009 low remains relatively the same. We are counting that low as the end of the bear market, and the beginning of a new Cycle wave bull market. Primary wave I of the five Primary wave bull market ended at SPX 1371 in April 2011. Primary wave II bottomed in October 2011 at SPX 1075. Primary wave III has been underway since then. In the DOW we can count five waves up from the Primary wave II low, and we are now accepting these five waves up as a completed Major wave 1. This is our preferred count. Since the SPX, and for that matter the NDX, are mainly futures driven. We can not totally rely on their market activity to define the quantified waves. The DOW, however, is the bellwether and always quantifies the waves perfectly.
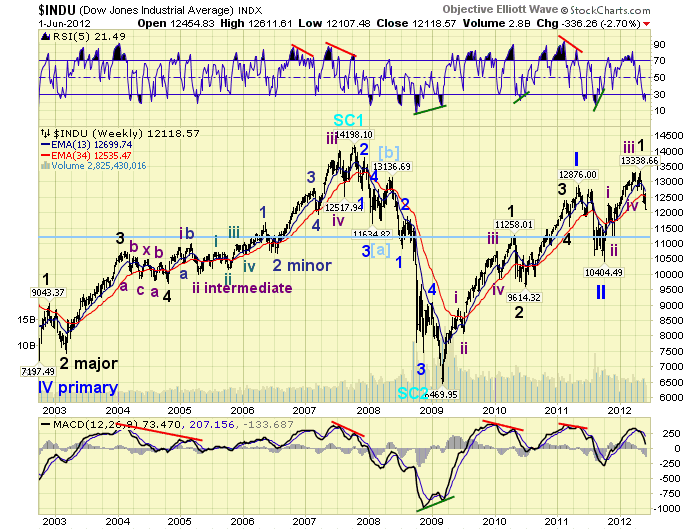
The weekly chart above displays the preferred count illustrating five Intermediate waves up into the DOW 13,339 May high. The correction underway now will be counted as Major wave 2. Notice this bull market has been somewhat choppy compared to the 2002-2007 bull market. And, it has been somewhat difficult to track. Nevertheless, our weekly RSI and MACD indicators continue to display positive signs although not as desirable as we would like.
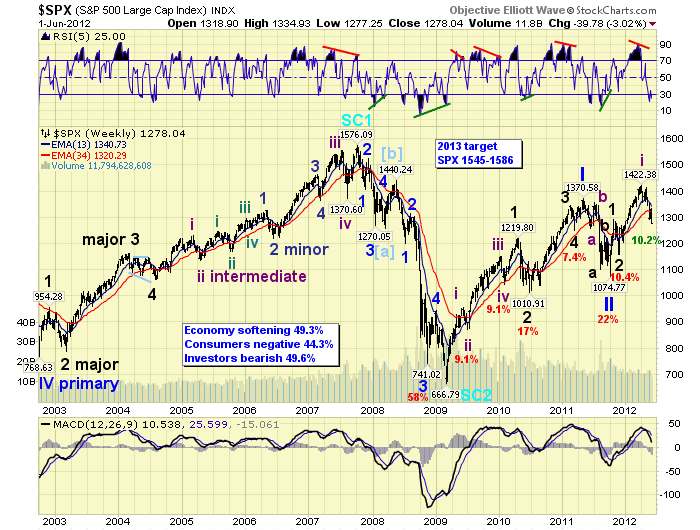
Our alternate count is posted on the SPX charts. This suggests the recent April high at SPX 1422 completed only Intermediate wave i of Major wave 3. It is in fact a more bullish count, suggesting an extension would be underway for Major wave 3. In light of what is unfolding in the foreign markets we believe this has a lower probability.
At the end of the public stock charts, on page 17, we have been carrying these two counts and one less bullish count. This third count suggests the October low only ended Major wave A of Primary II. Then the recent advance to April was Major wave B. Major wave C would now be underway to retest those October lows. We rank this count third lowest in probability. We have just added a fourth count, which is totally bearish. But we consider it a wild card at the moment, and rank it fourth in lowest probability.
One could state the bull market has entered another inflection point. Several possibilities have now arisen, three long term bullish and one bearish. We posted all four counts, in order of preference, at the end of the public stock charts - link at the end of the report. Overall, the market appears to be somewhat risky at the moment, with the break below the OEW 1291 pivot. The next uptrend will be quite important, and probably the determining factor longer term.
MEDIUM TERM: downtrend continues
When we view the current downtrend, in DOW terms, nothing looks unusual. The market advanced in five quantified waves up from the Oct11 low to the recent May12 high. The fifth wave advance was quite weak compared to waves one and three. Now the market is correcting into the range of the previous wave 1 high and wave 2 low. In Dow terms this is 11,232 to 12,284, the DOW closed at 12,119 on friday. In SPX terms this is 1159 to 1293, the SPX closed at 1278 on friday. Both are just entering this range.
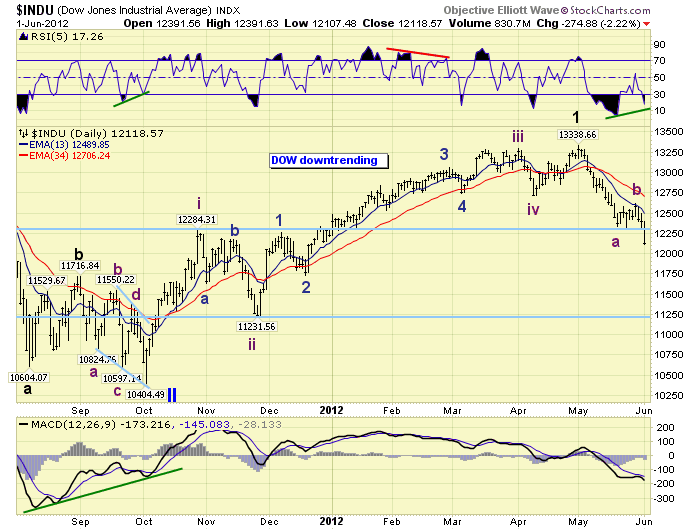
Remaining with the DOW count we have the following Fibonacci retracement levels for this correction: DOW 12,200 38.2%, DOW 11,870 50.0% and DOW 11,525 61.8%. Friday’s close just dipped below the 38.2% retracement level. The SPX equivalents are the following: SPX 1289 38.2%, SPX 1249 50.0% and SPX 1208 61.8%. The SPX also just dipped below the 38.2% retracement level on friday. The OEW pivots in descending order are: 1261, 1240 and 1222. This suggests there is support at the 1261 pivot, but more important support at the 1240 and 1222 pivots.
SHORT TERM
Support for the SPX remains at the 1261 and 1240 pivots, with resistance at the 1291 and 1303 pivots. Short term momentum is quite oversold. The short term OEW charts remain with a negative bias from SPX 1323, with the positive swing point now around 1310.
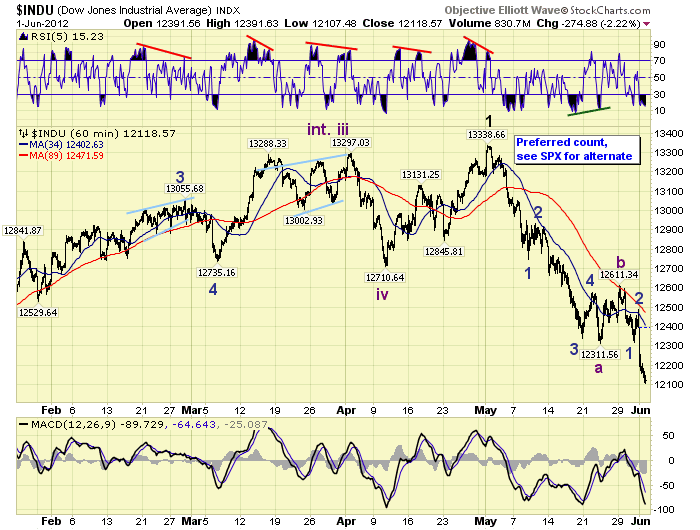
When we review the internal structure of this downtrend. It appears we have had five waves down from DOW 13,339 to 12,312 to end Intermediate wave A. Then a small corrective Int. B wave bounce to DOW 12,611, followed by an ongoing five wave decline for Int. wave C. When this concludes, the downtrend should also end. Using the same count on the SPX the structure is similar. A five wave Int. A decline to SPX 1292, an Int. B bounce to SPX 1335, and now a ongoing five wave Int. C decline.
Internal wave relationships suggest the following support levels: at DOW 11,975 Int. C = 0.618 Int. A, and at DOW 11,585 Int. C = Int. A. The equivalent SPX levels are 1259 and 1212. When we combine the Fibonacci retracement levels, (noted in the Medium Term section), with the internal wave structure we still arrive at the same OEW pivots as support: 1261, 1240 and 1222.
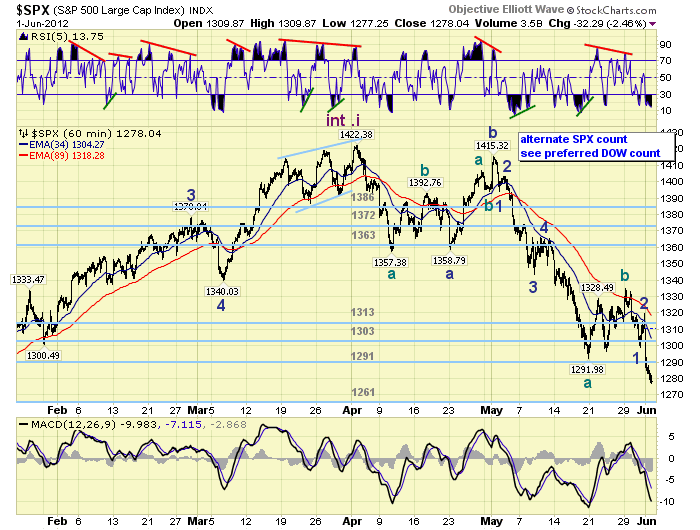
Looking a bit closer at this Intermediate C wave, we can see a Minor wave 1 down from SPX 1335 to 1299. A Minor wave 2 to SPX 1320, and a Minor wave 3 currently underway. Naturally to fit the SPX count into the DOW wave structure SPX 1415 would need to be counted as a fifth wave failure, and the correction would have started from that point. Best to your trading!
FOREIGN MARKETS
The Asian markets were mixed on the week for a net loss of 0.6%. All but China are in downtrends.
The European markets were all lower on the week losing 3.7%. All are in downtrends.
The Commodity equity group were all lower, are in downtrends, and lost 1.9%.
The DJ World index is also downtrending losing 2.7% on the week.
COMMODITIES
Bonds had an historic week, as 10 yr yields dropped to an all time low of 1.44%. The 30 year did likewise hitting 2.51%. For the week the uptrending bonds gained 1.4%.
Crude continued its downtrend losing 8.2% on the week. It has now dropped 26% from its spring high of $110.55. Previous spring selloff declines have been between 21% and 34%.
Gold was lower on the week until friday when it soared nearly $60. Friday was its best daily percentage gain since early 2009. For the week it gained 3.1%.
The USD continues to uptrend gaining 0.6% on the week. But it currently displays a negative divergence at extremely overbought levels. The EUR lost 0.7%, and the JPY rallied 2.2%.
NEXT WEEK
Economic reports start on monday with Factory orders at 10:00. On tuesday ISM services, and on wednesday we get a look at the FED’s beige book. On thursday, weekly Jobless claims and Consumer credit. Then on friday the Trade deficit and Wholesale inventories in this light reporting week. The FED has three events after weeks of inactivity. On wednesday FED governor Tarullo testifies before the Senate, and the FED vice chair Yellen gives a speech in the evening. On thursday, FED chairman Bernanke testifies before the Senate on the economic outlook and monetary policy. Should be an interesting week. Interesting times!
CHARTS: http://stockcharts.com/...
http://caldaroew.spaces.live.com
After about 40 years of investing in the markets one learns that the markets are constantly changing, not only in price, but in what drives the markets. In the 1960s, the Nifty Fifty were the leaders of the stock market. In the 1970s, stock selection using Technical Analysis was important, as the market stayed with a trading range for the entire decade. In the 1980s, the market finally broke out of it doldrums, as the DOW broke through 1100 in 1982, and launched the greatest bull market on record.
Sharing is an important aspect of a life. Over 100 people have joined our group, from all walks of life, covering twenty three countries across the globe. It's been the most fun I have ever had in the market. Sharing uncommon knowledge, with investors. In hope of aiding them in finding their financial independence.
Copyright © 2012 Tony Caldaro - All Rights Reserved Disclaimer: The above is a matter of opinion provided for general information purposes only and is not intended as investment advice. Information and analysis above are derived from sources and utilising methods believed to be reliable, but we cannot accept responsibility for any losses you may incur as a result of this analysis. Individuals should consult with their personal financial advisors.
© 2005-2022 http://www.MarketOracle.co.uk - The Market Oracle is a FREE Daily Financial Markets Analysis & Forecasting online publication.