


United States is Going Down Slow, Debt Problem is Global
Stock-Markets / Financial Markets 2012 May 30, 2012 - 11:56 AM GMTBy: UnpuncturedCycle

 The greatest discovery of my generation is that a human being can alter his life by altering his attitudes of mind.- William James (1842 - 1910)
If you believe everything you read in the newspaper it appears that the U.S. housing market is finally rising from a long slumber. Yet real estate Web site Zillow reports that homeowners are still under water. Nearly 16 million homeowners owed more on their mortgages than their home was worth in the first quarter, or nearly one-third of U.S. homeowners with mortgages. That’s a $1.2 trillion hole in the collective home equity of American households. Despite the temptation to just walk away and mail back the keys, nine of 10 underwater borrowers are making their mortgage and home loan payments on time. Only 10 percent are more than 90 days delinquent. Still, “negative equity” will continue to weigh on the housing market – and the broader economy – because it sidelines so many potential homebuyers.
It also puts millions of owners at greater risk of losing their home if the economic recovery stalls, according to Zillow’s chief economist, Stan Humphries. “If economic growth slows and unemployment rises, more homeowners will be unable to make timely mortgage payments, increasing delinquency rates and eventually foreclosures," he said. For now, the recent bottoming out in home prices seems to be stabilizing the impact of negative equity; the number of underwater homeowners held steady from the fourth quarter of last year and fell slightly from a year ago.

Real estate market conditions vary widely across the country, as does the depth of trouble homeowners find themselves in. Nearly 40 percent of homeowners with a mortgage owe between 1 and 20 percent more than their home is worth. But 15 percent – approximately 2.4 million – owe more than double their home’s market value. Nevada homeowners have been hardest hit, where two-thirds of all homeowners with a mortgage are underwater. Arizona, with 52 percent, Georgia (46.8 percent), Florida (46.3 percent) and Michigan (41.7 percent) also have high percentages of homeowners with negative equity.
In Europe things are deteriorating at a faster pace. Mini-bank runs have been experienced in Spain and Greece and in the UK the Spanish bank Banco Santander suspended operations on Friday supposedly because of technical difficulties with their system. In Spain a friend of mine told
|
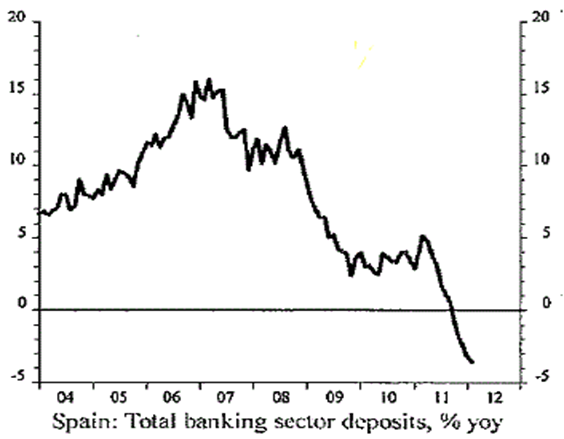
me that Bankia saw clients pull out close to US $2 billion on Friday alone. That’s capital flight and that’s as real as it gets. You may recall that this bank was nationalized less than two weeks ago so it appears people don’t have much faith in the government. The truth is that all the PIIGS are suffering considerable financial indigestion and there doesn’t seem to
|
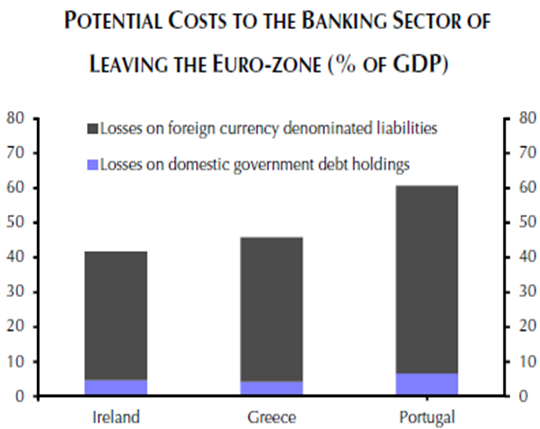
be any relief in sight. Yet as much as they are losing right now it pales in comparison to the cost of leaving the Euro zone. The entire EU banking sector is stuffed with bad debt from member nations as well as from the US. That means an exit would lead to a huge write-off, something no one wants to consider, especially Germany.
With respect to the G-8 meeting, the German Chancellor was the center of attention as her Germany has what the world is crying for: surplus wealth in a debt-laden world. The pressure was on Chancellor Merkel to provide enough liquidity so the EU can survive the moment as European nations are hemorrhaging wealth from the huge amount of debt owed to many global creditors. As the post-meeting communiqué revealed, there were few concrete proposals provided by the G-8 “brain trust” except that Germany “ought” to provide the financial backstop for all of Europe and, thus, the rest of the world. President Obama is well aware that any financial collapse in Europe will weigh heavily upon his reelection potential. I can tell you right now that Germany will not provide the liquidity the rest of the EU so desperately needs!
All of this is having effects that no one thought possible just one short year ago. Short-term interest rates on PIIGS debt is now above 6% in all but one case and above 7% in two cases. It goes without saying that interest rates on Greek debt are in the double digits, and even that is a struggle. Then we have the Euro falling to a twenty-two month low to 1.2517 on Friday against the greenback. In particular over the last two months each and every attempt to sell the dollar lower has been looked at by market forces as a buying opportunity. Who would have thought it?! On Wednesday we saw the spot US Dollar Index move and close above the January 13th closing high of 81.61 and it continued the break out on Thursday and Friday as you can see here:
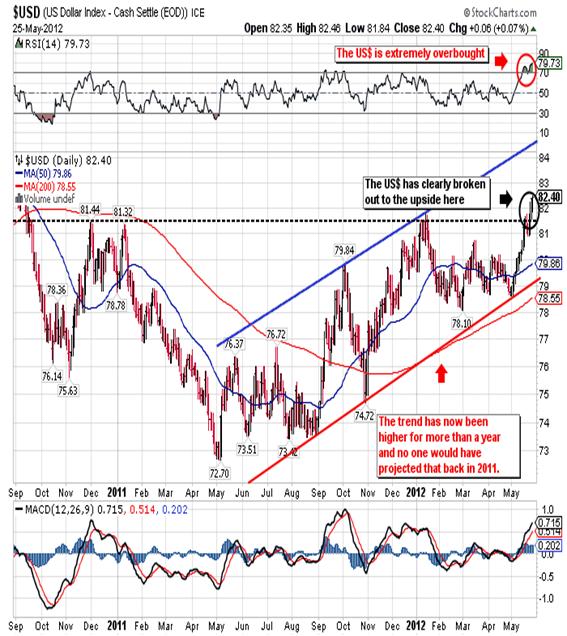
You have to go all the way back to 2010 to better Friday’s closing price of 82.40!
The US dollar will continue to rally over the short run as long as it is perceive as the lesser of all evils. The fact that everybody is printing fiat currency, even the normally stoic Swiss, and the dollar being the only one that is openly accepted anywhere in the world, makes the dollar attractive over the short run. Over the long run though the dollar must decline against any major currency that isn’t being printed, against gold and silver, and eventually against tangible assets like real estate and commodities. Of course the US could simply stop printing and the dollar would go up through the roof, but that would require political will to live within their means. That “will” is non-existent right now.
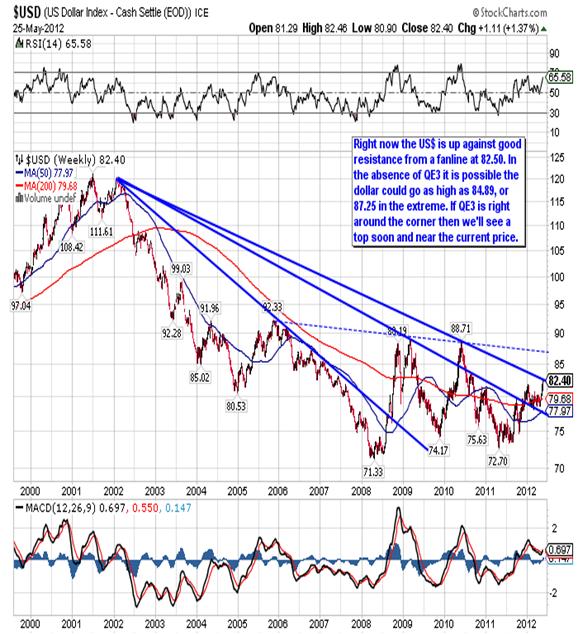
How high can the dollar go? That all depends on when we’ll see the next round of quantitative easing. If Mr. Obama wants to remain employed after November then we’ll more than likely see QE3 by the end of June and maybe even sooner. That would put the top somewhere between Friday’s closing price of 82.40 and strong resistance at 83.35. If QE3 is delayed beyond the end of June for any reason then strong resistance at 84.89 and even 87.25 come into play. Any of those numbers would have nasty consequences for the unspoken Fed policy of inflating away US debt by devaluating the US currency.
The other beneficiary of European incompetence has been the US bond market. As countries like Greece, Spain, Portugal and Italy are forced to pay a higher rate for short-term money, do to the perception that they are now a bigger risk, investors flock to US treasuries. The fact that the US dollar has appreciated over the last year does compensate somewhat for the miserable interest rate they pay. When you factor in inflation the interest rate is actually negative, but investors are willing to accept that because they feel that their capital is safe. The same cannot be said if you buy Greek, Spanish, Portuguese or Italian sovereign debt.
As a result of the European problems, China’s apparent hard landing, Japan’s massive debt load and struggling economy, investors have now driven US rates down to all-time lows and inversely bond prices have gone to all-time highs as you can see in this twenty-year chart of the 30-Year
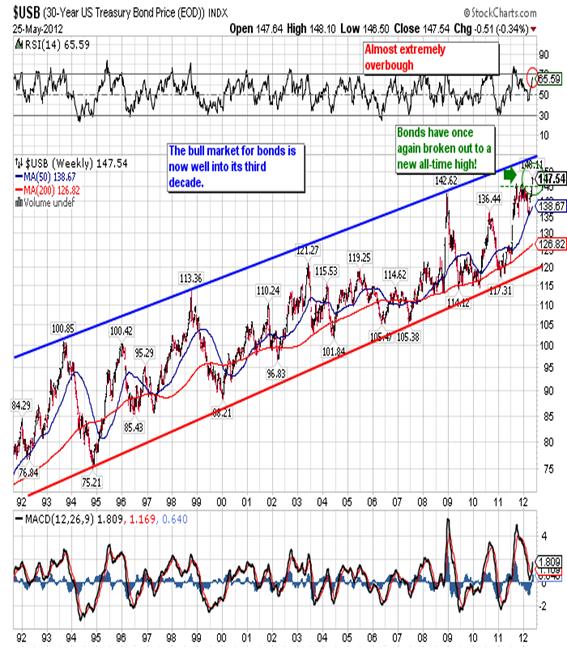
US Treasury. This gains over the last three years are even more difficult to comprehend when you stop to think that the US Federal Reserve has expanded their balance sheet almost eightfold over that same period. Currently the Fed is auctioning debt at the US $25 billion/week pace with no let-up in sight!
The most recent new high can more than likely be attributed to the poor results from the EU’s meeting this week. Once again Europe's leaders swooped into Brussels and vanished hours later without offering any clear way out of the pulsating crisis at hand. There is nothing the market hates more than uncertainty and the EU is a champion at creating uncertainty. As result the money flows out of Greek, Spanish, Italian, Portuguese and even French banks and into US bonds that can by bought/sold on just about any street corner in any major city around the world. How long will this last? Until the weight of QE3, and maybe QE4, outstrips the worries about Europe, China and Japan. Once QE3 comes out, and fails, QE4 will not be far behind and that will finish off the dollar and the bond as the Fed prints its way toward the dubious honor of being “the buyer of last and only resort”.
Another reason for the higher bond prices could be tied to the deflating stock market. In spite of gaining close to 200 points for the week the Dow is down fifteen out of the last eighteen days. Mind you there are no signs of fear or panic; rather it’s just a slow motion decline that lulls you to sleep. It’s so gradual that investors probably get out of bed each morning sure that ‘today’s the day’ it will turn around. So far they’ve been wrong fifteen out of eighteen days!
On Friday the Dow opened slightly higher only to gradually sell off the rest of the day, closing down 74 points at 12,454. With the exception of Monday every single rally this week was sold into, and that’s basically been the pattern since the May 1st closing high:
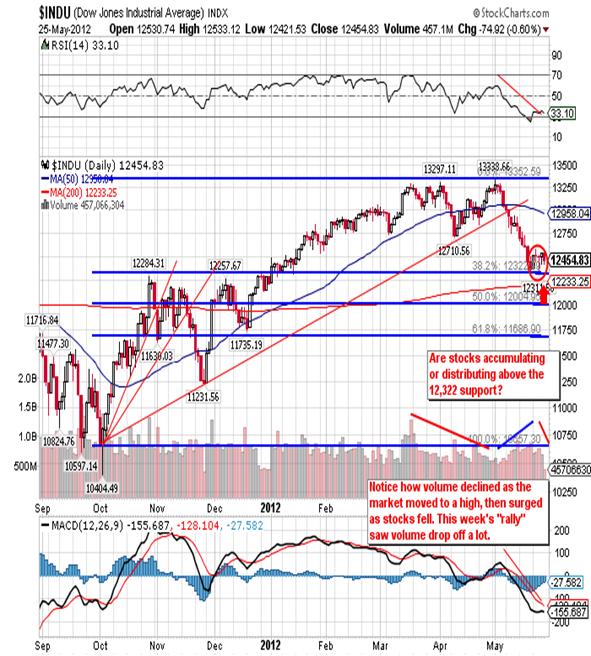
Finally, notice how the decline stopped right at the first line of support, the 38.1% retracement at 12,322. Since the decline failed to penetrate that support level, the trend remains “up”.
Now I want to focus on the decline itself in order to gain some insight into what we can expect over the coming days and weeks, but first let me preface that by saying that I think the top is in and we are beginning the second leg down in a bear market that began way back in October 2007. With
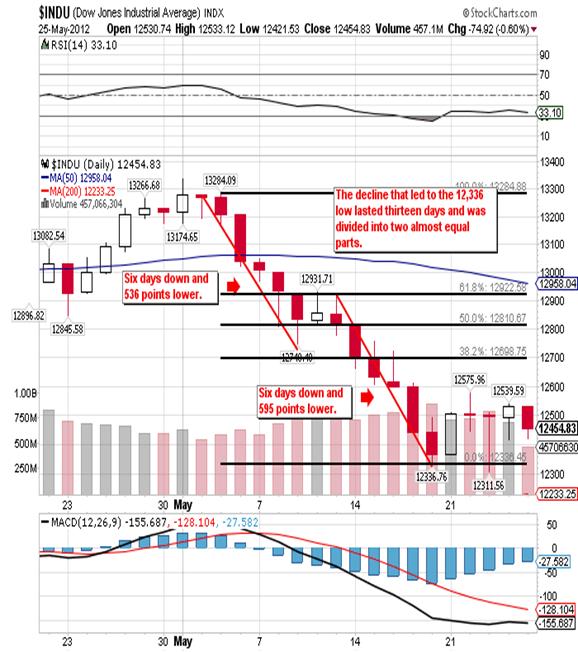
that in mind the first thing to notice as that the decline that produced the 12,336 low was divided into two separate parts, equal in time and fairly close in points. This is important because if the first thrust was much larger than the second thrust then we could expect one last small move down or even a false break for a bottom. But since these are equal there is little in the way of probability. Instead the 12,336 low produced a sharp move up on Monday with almost little or no follow through the rest of the week. I also have a problem with the rally that occurred since it never came anywhere near decent resistance at 12,696. I was looking for a three/four day counter tend move to 12,696 in order to sell the market short. Instead the high came at 12,575 after two days and we have what appears to be a lower high on the forth day! That convinced me to take a small short position at 12,570 in the June futures contract early Friday morning.
I obviously feel the market will decline or I wouldn’t short it, but I really have no proof. The decline failed to penetrate the 12,332 support in order to turn the trend down while the ensuing rally failed to penetrate good resistance at 12,696. So it’s a sort of no man’s land although I do have one big factor in my favor: both the Dow and Transports closed below their respective March 6th closing lows. In the rally that followed the closing lows, I should mention that the Transports did manage to rally back up to decent resistance at 5,047 and did close above it as you can see below:
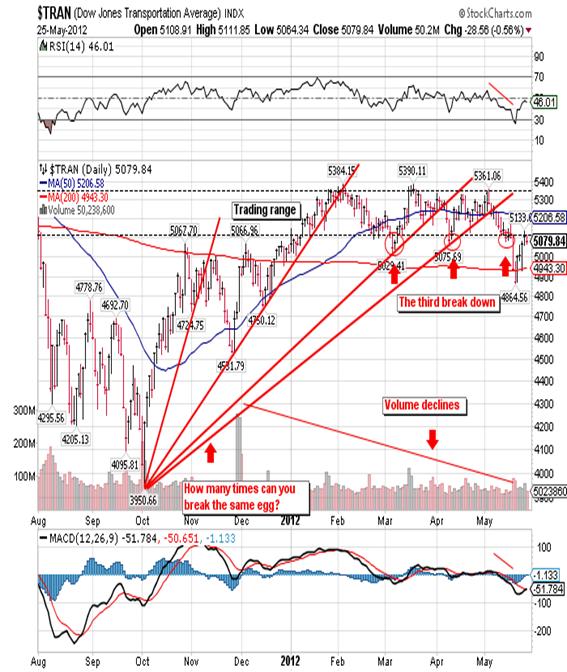
Of course you already know that the Dow did not follow the same path. Perhaps the most telling indicator is a combination of low volume on rallies and the growing negative spread between Lowry’s Buying Power and Selling Pressure. So when I add it all up I feel you have to either be out of the market or short. Given the over all lack of value I see in the market, I will remain short as long as I don’t see a close above 12,696 in the Dow.
I am not going to spend a lot of time on commodities other
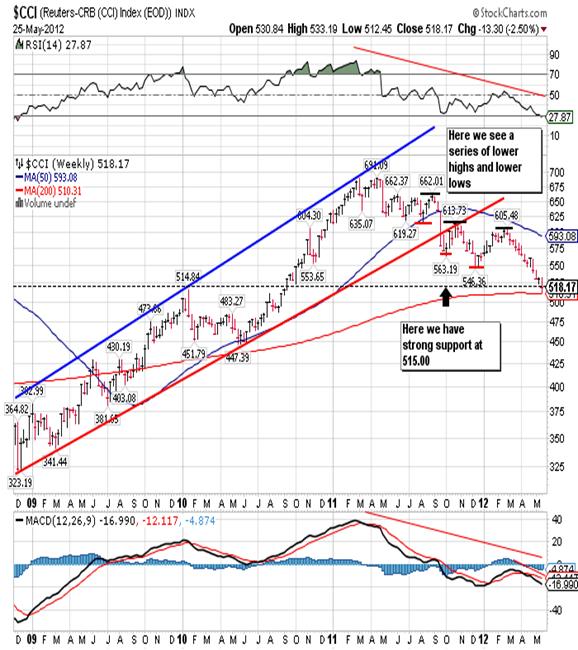
than to say they had a rough week in spite of a rally in wheat and a half-hearted attempt at recoveries in oil, copper, cotton and coffee. You’ll note that on Friday the CRB Index actually traded below the strong support at 515.00 that I’ve mentioned so many times. It closed out the week at 518.17, and in spite of the fact that most commodities are extremely oversold, I can’t think of a good reason for them to rally. I covered most of my short positions on Wednesday after two days of sharp declines. I had hopes that we would see some kind of relief rally, but I may have been wrong.
Gold also had a very interesting week as it abruptly decided
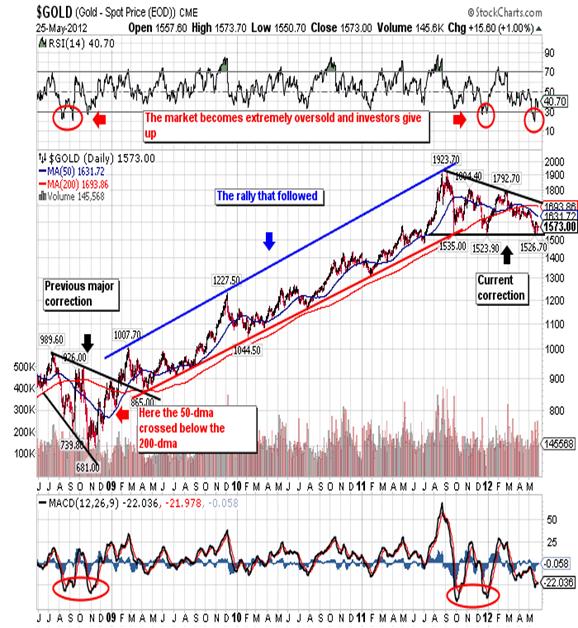
on Wednesday to retest the 1,526.70 low from May 16th, just two days after trading as high as 1,599.00! Of course you could hear the collective groan from those who jumped into the fray late. Spot gold fell as low as 1,532.80 on Wednesday before rallying to close out the week at 1,573.00. Of course I view this as a retest, something I warned about in the last weekend report, and I’m more than satisfied with the result.
In fact I view the third test of critical support at 1,522.20 followed by this week’s retest as extremely bullish. If gold would have produced a lower low this week there is no telling when it would have stopped falling; I could even have made a case for gold as low as 1,375.00. I now believe the risk of a collapsing gold price is finally behind us and feel more than comfortable with the last purchases I made at 1,535.00 and 1,549.00, and will no longer attempt to trade in an out. As long as gold holds above 1,535.00 I see no problems what so ever. Below you’ll find the relevant Fibonacci support/resistance numbers for the June contract:
CONTRACT SUPPORT RESISTANCE
June Gold 1,562.10 1,579.80
1,544.40 1,599.50
1,535.50 1,616.60
Finally, I will look to add on once I see a close above 1,599.50.
One of the reasons I am so bullish about gold over the long run has to do with continued central bank buying. The latest official Central Bank gold holding figures from the IMF confirm that Central Banks around the world are continuing to buy gold - some in pretty large quantities which should be yet another stabilizing factor for the gold price - and if the trend continues suggests that the CBs will buy even more this year than last - and that's only the ones which let the world know exactly what their gold reserves are! The latest figures not only show some substantial gold buying in April, but also a big lift in gold purchases by The Philippines which actually date back to March, but were slow in being notified to the IMF. The Philippines' March gold purchases amounted to no less than 1.033 million ounces - 32 tons - of the yellow metal - the biggest volume since Mexico bought around 78 tons a little over a year ago - and increased that country's gold reserves by almost 20%.
The Philippines was not the only laggard in reporting increased gold reserves though. Tiny Sri Lanka raised its reserves by an even greater 39%, but dating back to January, with a rise of 2.177 tons to 7.807 tons - obviously far less significant in the global picture but yet another indication of the perceived significance of gold in particular in the Asian economies. The most significant reported gold purchases in April itself included 29.7 tons by Turkey (a 14% increase in its reserves, but this is thought to have largely been due to its policy of acceptance of gold as collateral from commercial banks), 2.92 tons by Mexico, 2.02 tons by Kazakhstan, and 1.4 tons by the Ukraine.
The continued buying by Central Banks does continue to indicate an underlying unease about the sovereign debt situation and its impact on the value of some key reserve currencies- not least the dollar and the euro. In an email to Mineweb respected New York gold analyst, Jeff Nichols, commented, "The latest IMF data on central bank gold reserves was just released earlier today -- showing gold purchases by Mexico, Kazakhstan, Ukraine, Russia, and the Philippines. Undoubtedly, China and perhaps a few other countries bought gold but did not report their purchases to the IMF." This reiterates the widespread belief that some countries - of which China is thought to be the major entity - for political reasons do not report their total holdings to the IMF, but hold new gold purchases in accounts that are not reported until it is considered politically expedient to do so. Last time China reported an increase in reserves was in 2009.
Since then there has been much speculation that China could be building up its reserves at a rate of four or five hundred tons a year or more given the level of domestic gold production and the big surge in imports seen. Although China is the world's sixth largest holder of gold, the metal only represents a tiny 1.8% of its reserves and there have been a number of presumably government approved (is there anything else in China?) statements by officials that do suggest the nation is carefully buying on dips in the gold price so as not to create disruption in a relatively orderly global gold market.
Overall reported Central Bank gold purchases last year amounted to over 450 tons - the highest for nearly 50 years and The World Gold Council and GFMS have suggested that this year will see another 400 tons or more flowing into Central Bank coffers - and the purchases to date suggest that this target may well be achieved. Gold may have fallen out of Central Bank favor for a few decades but the realization now is increasingly that it should be a significant part of a country's foreign reserve base as fiat currencies the world over lose their intrinsic value. Personally I can’t think of a better reason to load up on the yellow here and now. If Central Banks are buying it’s because they know something. They know that debt and fiat currency creation are going to lead the world’s economy to a bad end. The only solution is gold!
CONCLUSION
The real problem continues to be debt. It’s not just in Europe; it’s everywhere! This last week we witnessed meetings of the G-8 and the EU commission, supposedly to discuss debt, and they were followed by platitudes and no solutions. Debt is a plague found in Japan, China, and Europe and of course the US. If the truth were known America is the worst offender and it continues to create debt at a rate that exceeds US $20 billion per week. The typical American household would have paid nearly all of its income in taxes last year to balance the budget if the government used standard accounting rules to compute the deficit, this according to a USA TODAY report. Under those accounting practices, the government ran red ink last year equal to $42,054 per household — nearly four times the official number reported under unique rules set by Congress.
A U.S. household's median income is $49,445, the Census reports. The big difference between the official deficit and standard accounting: Congress exempts itself from including the cost of promised retirement benefits. Yet companies, states and local governments must include retirement commitments in financial statements, as required by federal law and private boards that set accounting rules. The deficit was $5 trillion last year under those rules. The official number was $1.3 trillion. Liabilities for Social Security, Medicare and other retirement programs rose by $3.7 trillion in 2011, according to government actuaries, but the amount was not registered on the government's books.
The federal government calculates the deficit in a way that makes the numbers smaller than if standard accounting rules were followed. Deficits are a major issue in this year's presidential campaign, but USA TODAY has calculated federal finances under accounting rules since 2004 and found no correlation between fluctuations in the deficit and which party ran Congress or the White House. I’m sure that doesn’t come as much of a shock to you. Here are some of the key findings:
•Social Security had the biggest financial slide. The government would need $22.2 trillion today, set aside and earning interest, to cover benefits promised to current workers and retirees beyond what taxes will cover. That's $9.5 trillion more than was needed in 2004.
•Deficits from 2004 to 2011 would be six times the official total of $5.6 trillion reported.
•Federal debt and retiree commitments equal $561,254 per household. By contrast, an average household owes a combined $116,057 for mortgages, car loans and other debts.
"By law, the federal government can't tell the truth," says accountant Sheila Weinberg of the Chicago-based Institute for Truth in Accounting. Jim Horney, a former Senate budget staff expert now at the liberal Center on Budget and Policy Priorities, says retirement programs should not count as part of the deficit because, unlike a business, Congress can change what it owes by cutting benefits or lifting taxes. "It's not easy, but it can be done. Retirement programs are not legal obligations," he says. When is an obligation not an obligation? When the government says so! Sooner or later the government will meet reality right square in the face and will have to declare itself unable to pay its debt. That day may not be all that far away!
PIIGS stands for Portugal, Italy, Ireland, Greece and Spain.
Actually Friday’s close was 50 points below Monday’s close so the market lost ground.
Giuseppe L. Borrelli
www.unpuncturedcycle.com
theunpuncturedcycle@gmail.com
Copyright © 2012 Giuseppe L. Borrelli
- All Rights Reserved Disclaimer: The above is a matter of opinion provided for general information purposes only and is not intended as investment advice. Information and analysis above are derived from sources and utilising methods believed to be reliable, but we cannot accept responsibility for any losses you may incur as a result of this analysis. Individuals should consult with their personal financial advisors.
© 2005-2022 http://www.MarketOracle.co.uk - The Market Oracle is a FREE Daily Financial Markets Analysis & Forecasting online publication.