


Silver Presenting Excellent Risk Reward Opportunity
Commodities / Gold and Silver 2012 May 22, 2012 - 12:56 PM GMTBy: Clive_Maund

 The patterns forming in gold and silver are remarkably similar, and much of what has been written in the parallel Gold Market update applies equally to silver, so it will not be repeated here. The big question is "has silver finally bottomed?" - that is the question that we are going to attempt to answer in this update.
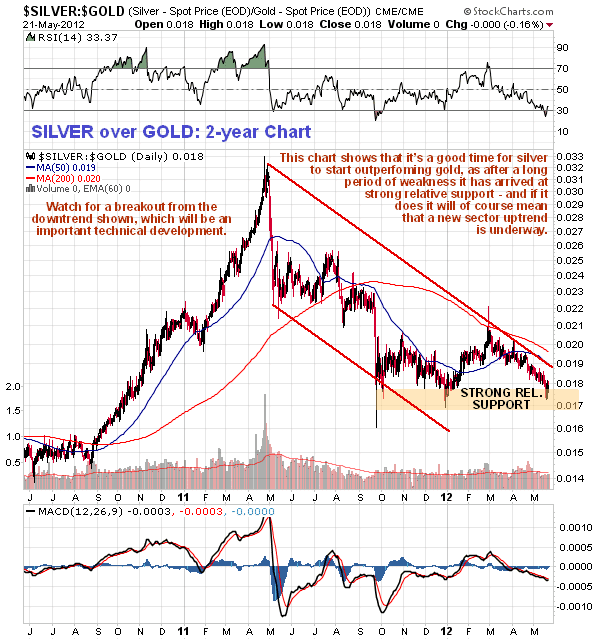
The chief difference between gold and silver is that silver is much more volatile than gold and thus serves as a vehicle to obtain more leverage on moves in the Precious Metals sector, in either direction. This is demonstrated by the silver to gold ratio chart, which we will look at shortly, which shows that when the sector is depressed, silver falls more in percentage terms than gold does.
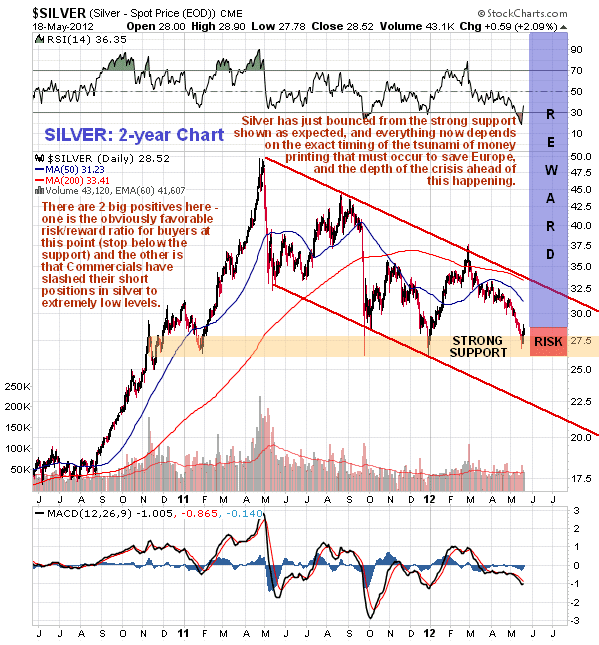
On its 2-year chart we can see that while silver aborted its potential Head-and-Shoulders bottom pattern, in the same way that gold aborted its Head-and-Shoulders continuation pattern, like gold it may be forming some other reversal pattern, such as a Triple Bottom. In any event its arrival at key support at its September and December lows has resulted in a bounce, as we expected it would, and the crucial question as with gold is whether this bounce is just that, a bounce and nothing more, or whether it marks an important low before a major uptrend begins.
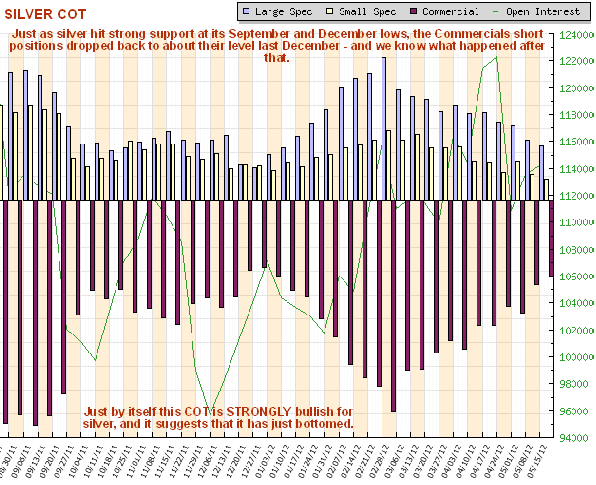
In attempting to answer this question many of the arguments set out in the parallel Gold Market update in relation to gold apply equally to silver, but one important difference should be highlighted. While gold's latest COT chart certainly looks bullish, silver's is much more strongly so, with the Commercial short positions having dropped to a very low level - about the same level as that which preceded the big rally in silver in January and February. Just by itself this strongly implies that silver has just hit an important low and that a new uptrend is dead ahead.
The 2-year silver to gold ratio chart is very interesting. While silver bugs were walking tall back in April 2011, with many being egged on by former vacuum cleaner salesmen etc, they are now almost ashamed to admit to owning the metal. This is certainly a good sign and this ratio chart shows that we are definitely at a good point for silver to start outperforming gold, as it is on strong relative support which has produced a turnaround twice over the past year, and if it starts outperforming gold it means that a PM sector uptrend will be under way.
Everything now depends on market perceptions with regard to the massive wave of QE that is believed to be slated to stave off total chaos in Europe and buy some more time there. If this is not forthcoming and the forces of deflation precipitate a market crash, then of course silver could breach nearby support which would lead to another sharp drop, but if it is, then silver is in position to start a major upleg from here, which given the magnitude of the impending QE, could be truly massive and part of a broad based advance in the commodity sector as the QE, and the massive stimulus already applied, works its way through the system resulting in severe inflation or even hyperinflation.
Regardless of whether or not we have just made an important bottom - and the latest COTs strongly suggest that we have - one thing is as clear as crystal; we have an excellent risk/reward ratio for those going long silver here as shown on its 2-year chart above, as buyers can place a close stop just below the support, and it will be even better if the price reacts back towards last week's low again in the near future. If the deflationary forces gain the ascendancy short-term then you will be taken out for a relatively minor loss, but if the expected QE is unveiled to save the day, then we could see a truly massive advance from here.
By Clive Maund
CliveMaund.com
For billing & subscription questions: subscriptions@clivemaund.com
© 2012 Clive Maund - The above represents the opinion and analysis of Mr. Maund, based on data available to him, at the time of writing. Mr. Maunds opinions are his own, and are not a recommendation or an offer to buy or sell securities. No responsibility can be accepted for losses that may result as a consequence of trading on the basis of this analysis.
Mr. Maund is an independent analyst who receives no compensation of any kind from any groups, individuals or corporations mentioned in his reports. As trading and investing in any financial markets may involve serious risk of loss, Mr. Maund recommends that you consult with a qualified investment advisor, one licensed by appropriate regulatory agencies in your legal jurisdiction and do your own due diligence and research when making any kind of a transaction with financial ramifications.
Clive Maund Archive |
© 2005-2022 http://www.MarketOracle.co.uk - The Market Oracle is a FREE Daily Financial Markets Analysis & Forecasting online publication.