


Gold Triple Bottom and Stocks Oversold – Now What?
Stock-Markets / Financial Markets 2012 May 21, 2012 - 04:21 AM GMTBy: Willem_Weytjens

 On Gold:
Gold has now made a bullish reversal on a weekly basis, as price rallied sharply on Thursday and Friday.
Support held, which means Gold could be on the verge of setting a double/triple bottom around $1,550:
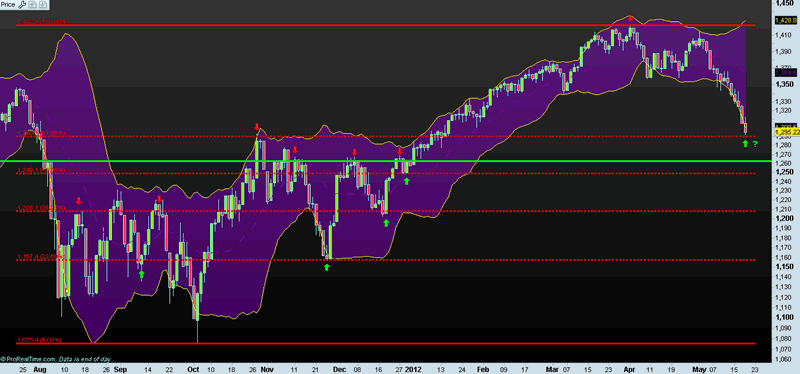
Chart courtesy Prorealtime.com
On a monthly basis, we can see that the Bollinger Bands are narrowing, indicating that volatility has been low over the past couple of months (although it might not have felt like that for some traders). Volatility will not stay this low forever, so Gold is now getting ready for the next BIG MOVE. Notice that I am talking about a MONTHLY chart here, I am not talking about the day-to-day volatility (which has been quite extreme from time to time). This also means that it might take several more months before the next BIG move actually starts. However, keep an eye on the monthly Bollinger Bands, and follow the trend when the next Big Move starts.
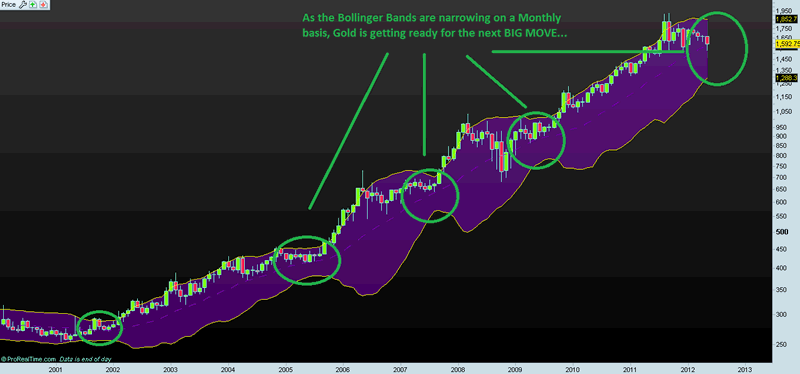
Chart courtesy Prorealtime.com
On Silver:
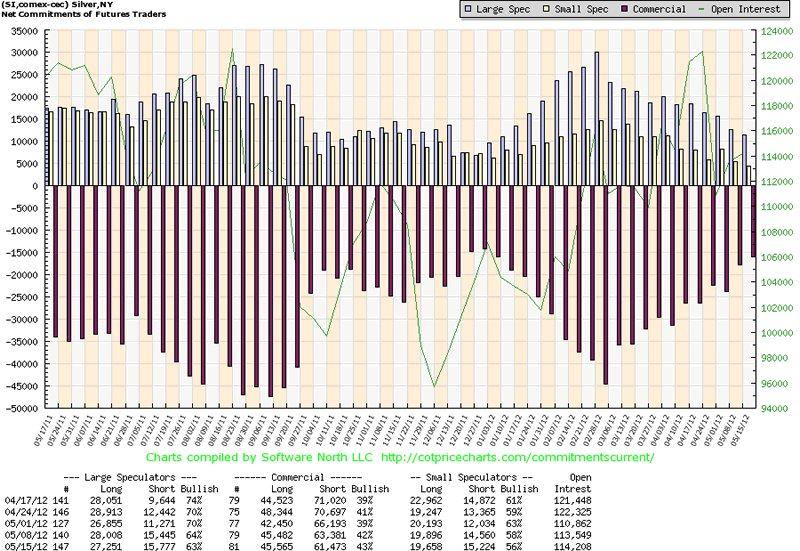
Shorter term, we can see that the Commercials have reduced their Net Short positions in Silver to 15,980 contracts, a level not seen since late 2011, a time when Silver set a bottom at roughly the same price level as where it is trading today:
On Gold Miners:
The chart below illustrates the fact that Sentiment in Gold Mining Stocks is extremely low (illustrated by the Bullish Percent Index, which shows the % of stocks with a Buy signal on the Point & Figure Chart) . The green vertical lines show that almost every time sentiment is depressed, the HUI index is about to turn UP. The only 2 times it didn’t mark a bottom was in late 2008 and more recently, a couple of weeks ago.
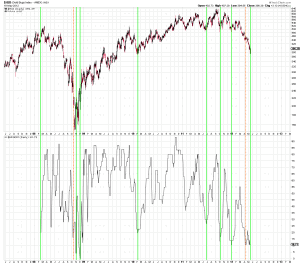
Chart courtesy stockcharts.com
Not only is sentiment in Gold stocks depressed, it is also depressed relative to sentiment in the SP500, as illustrated by the chart below, which plots the ratio of $BPGDM by $BPSPX (the % of stocks in the SP500 with a Buy signal on the Point & Figure chart).
We can see that whenever sentiment in Gold miners (lower part) was depressed, it was not just “depressed”, but it was also depressed relative to sentiment in the SP500, and soon sentiment turned up in favor of Gold mining stocks
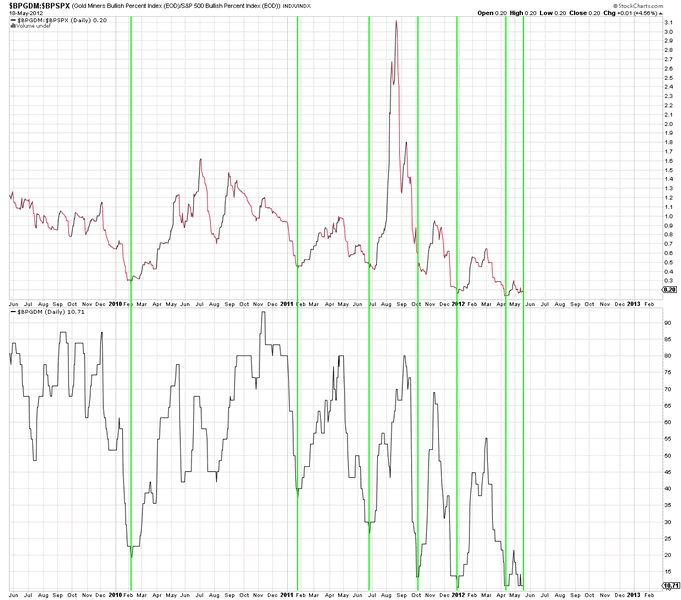
Chart courtesy stockcharts.com
On Equity markets:
The SP500 has now reached the 61.80% Retracement Level from the bottom in October 2011 to the top in April 2012.
Bollinger Bands are still widening, indicating that the Bottom is still not in sight. We haven’t seen real capitulation yet, although the SP500 was down 11 out of 13 trading days, with a maximum 0.25% rally on May 10th.
Next support comes in at 1,250-1,260 (50% Retracement Level & previous resistance line).
Chart courtesy Prorealtime.com
…
52.40% of the stocks in the SP500 are trading at the lowest level in 50 days, which is 5 standard deviations from the mean, which doesn’t occur that often:
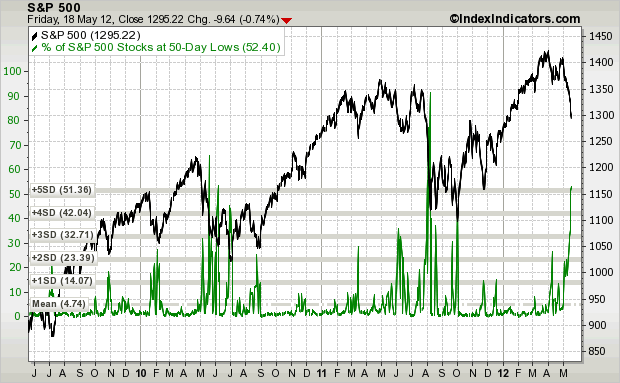
Chart courtesy indexindicators.com
The following chart shows that the best times to buy stocks was in 1949 and 1982, and the best time to sell stocks was in the mid-60′s and in 2000. If history is any guide, then we should wait to buy stocks until this cycle is finished. This means it could take another 8-10 years before the next big Bull market starts:
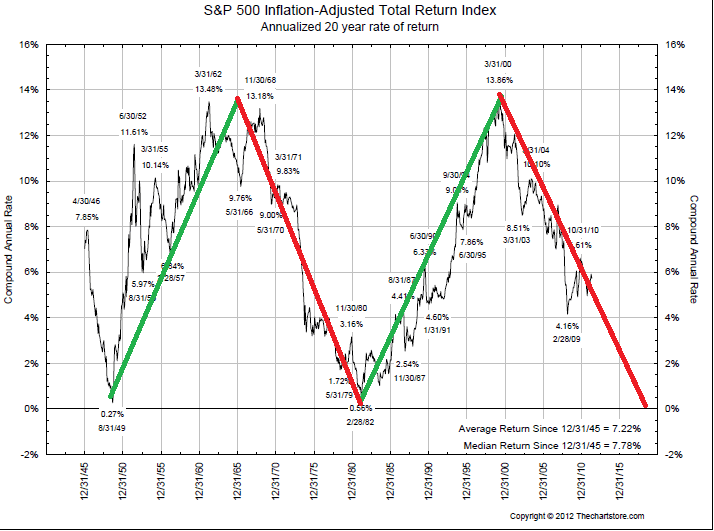
Chart courtesy thechartstore.com
I then checked out the SP500 Inflation-Adjusted Total Return Index itself. We can clearly see that the index has been in a consolidation phase since 2000, just like from 1929 to 1949 (20 years) and from 1962 to 1982 (20 years). If this cycle (consolidation phase) also lasts 20 years, it means we have to wait until 2020 before the next bull market starts, which is in line with the statement above:
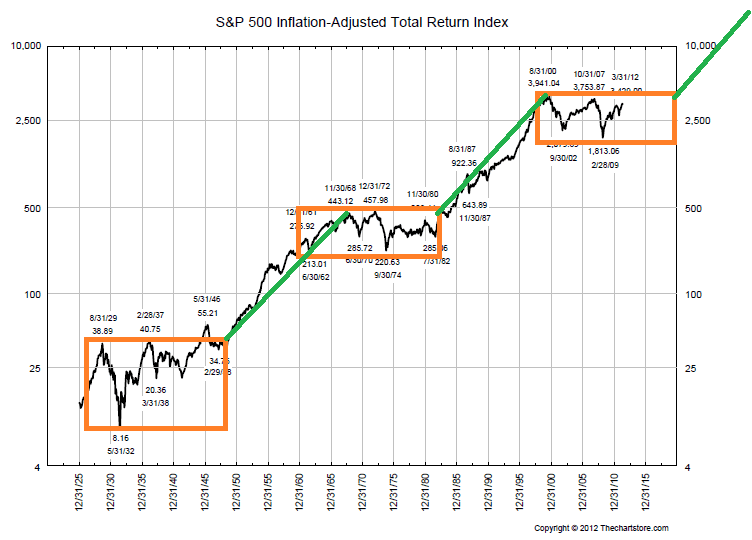
Chart courtesy thechartstore.com
On Bonds:
TLT is trading at 24.98% above its 150 weeks Exponential Moving Average and 29.82% above its 200 weeks Exponential Moving Average, which is quite stretched:
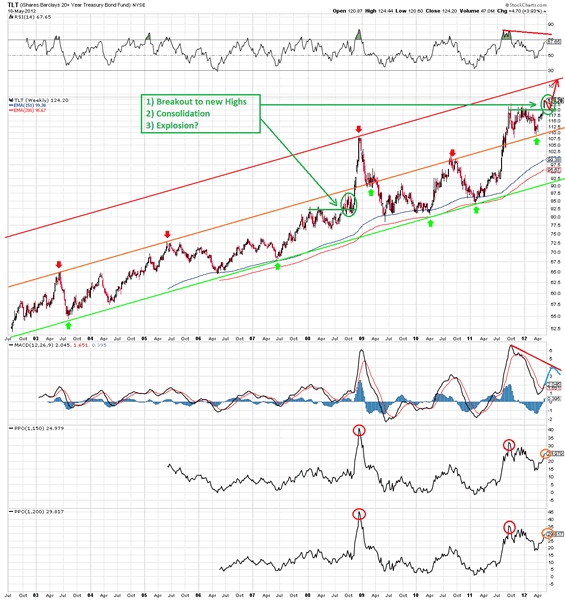
Chart courtesy stockcharts.com
In the original article, we look at Sentiment Charts, Put/Call ratio’s, UP issues Ratios, and more.
Since the original article was very long, I hereby provide an excerpt of the article “Gold Tripple Bottom & Stocks Oversold (Short Term) – Now What?” (Subscribers, click HERE to read the entire article).
I have decided to only accept new subscribers until June 30th. From then on my services will be open to existing subscribers ONLY. To secure your membership now, visit www.profitimes.com and subscribe now!
Willem Weytjens
www.profitimes.com
© 2012 Copyright Willem Weytjens - All Rights Reserved
Disclaimer: The above is a matter of opinion provided for general information purposes only and is not intended as investment advice. Information and analysis above are derived from sources and utilising methods believed to be reliable, but we cannot accept responsibility for any losses you may incur as a result of this analysis. Individuals should consult with their personal financial advisors.
© 2005-2022 http://www.MarketOracle.co.uk - The Market Oracle is a FREE Daily Financial Markets Analysis & Forecasting online publication.