Stock Market Cycles Indicate Downtrend Incomplete
Stock-Markets / Cycles Analysis May 17, 2012 - 02:14 AM GMTBy: Mike_Paulenoff
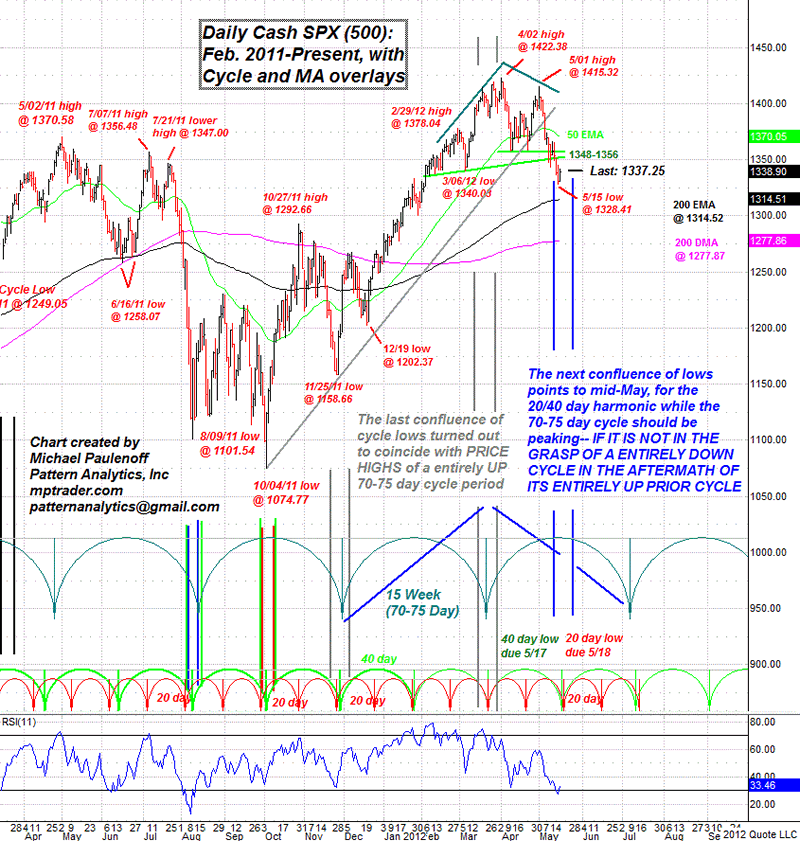
The S&P 500's 20 & 40 day cycle lows are due May 17-18, which pretty much means any time now. In view of today's strength, was yesterday's low THE CYCLE LOW? Or is this up-move a head fake ahead of another plunge in the indices into Thursday & Friday, or perhaps into next Monday or Tuesday (in the event of a late cycle low)?
Then there is the issue of the overriding 70-75 day cycle, which is expected to bottom during the first week of July Considering that the entire prior 70-75 day cycle, from the November 2011 low to the March 2012 high was UP, the next cycle (meaning the current one) more often than not is entirely DOWN or negative.
Given the cyclic forces, if today's rally gives up its gains (and the e-SPM already is 8 points off of its AM high) and intraday reverses to the downside, I will be thinking that the relief rally is a flash in the pan and the dominant downtrend is alive and well and not yet completed.
ETFs for playing the cycle trends are the SPDR S&P 500 (SPY), ProShares Ultra S&P 500 (SSO), and ProShares UltraShort S&P 500 (SDS).

Sign up for a free 15-day trial to Mike's ETF & Stock Trading Diary today.
By Mike Paulenoff
Mike Paulenoff is author of MPTrader.com (www.mptrader.com), a real-time diary of his technical analysis and trading alerts on ETFs covering metals, energy, equity indices, currencies, Treasuries, and specific industries and international regions.
© 2002-2012 MPTrader.com, an AdviceTrade publication. All rights reserved. Any publication, distribution, retransmission or reproduction of information or data contained on this Web site without written consent from MPTrader is prohibited. See our disclaimer.
Mike Paulenoff Archive |
© 2005-2022 http://www.MarketOracle.co.uk - The Market Oracle is a FREE Daily Financial Markets Analysis & Forecasting online publication.


