


Gold Questioning Fed's Effectiveness
Commodities / Gold and Silver 2012 May 11, 2012 - 01:34 AM GMTBy: Chris_Ciovacco

 Central bankers want us to believe that monetary policy is about banks, interest rates, and the ability to get a "cheap" loan. The 2002 quote below from Ben Bernanke points to the primary goals of printing money - to boost asset prices and "scare' people into consuming and investing before prices go up.
Like gold, U.S. dollars have value only to the extent that they are strictly limited in supply. But the U.S. government has a technology, called a printing press (or, today, its electronic equivalent), that allows it to produce as many U.S. dollars as it wishes at essentially no cost. By increasing the number of U.S. dollars in circulation, or even by credibly threatening to do so, the U.S. government can also reduce the value of a dollar in terms of goods and services, which is equivalent to raising the prices in dollars of those goods and services. We conclude that, under a paper-money system, a determined government can always generate higher spending and hence positive inflation.
If you question the goal of boosting asset prices, watch this 2010 video, which explains how quantitative easing works in the real world. As seen via the price of gold, the markets have been questioning that "a determined government can always generate higher spending and hence positive inflation."
When you update market models every day, you notice subtle shifts in investors' perceptions relative to risk and inflation. While it looks flat in the chart below, the slope of gold's 200-day moving average ticked down on Wednesday.
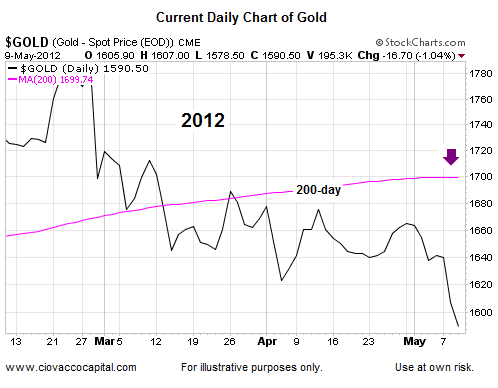
The 200-day moving average (MA) is commonly used by traders to monitor long-term trends. Gold is now below its 200-day MA and the slope is trying to roll over; both lean bearish for gold. Since the 200-day monitors long-term trends, the analysis here is related to the longer-term outlook.
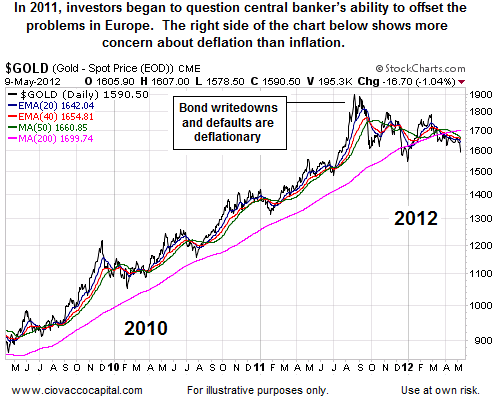
Gold is commonly used by investors as a hedge against inflation. Inflation can surface after a significant round(s) of money printing from central banks, like the Fed and European Central Bank (ECB). The central bankers are fighting deflationary forces related to the purging of debt, which can occur via writedowns or defaults. Greece recently wrote down their debt, meaning they told bondholders you will get less back than we originally promised when your bond matures. A writedown is deflationary since it destroys wealth and reduces the amount of money in the financial system.
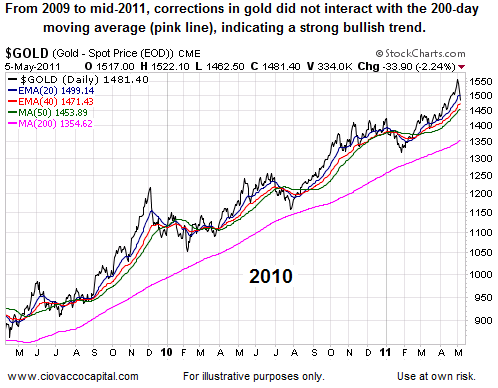
Gold is an excellent way to monitor investors' perception of how the battle between inflationary forces (money printing) and deflationary forces (purging debt) is playing out. In the chart below, investors were betting on the central bankers and inflation. The black line is the price of gold. The thin colored lines are moving averages, which are used to filter out the noise of day to day volatility. The chart below shows a strong trend and bias toward future inflation.
When Europe's enormous debt problems became the market's primary focus in mid-2011, investors began to realize how big, and how deflationary, the problem was. The right side of the chart below looks quite different than the left side. Notice on the left side, price never came back to the 200-day, nor did the "faster" moving averages ever cross the 200-day. The right side of the chart looks different and breaks the pattern of inflationary fears.
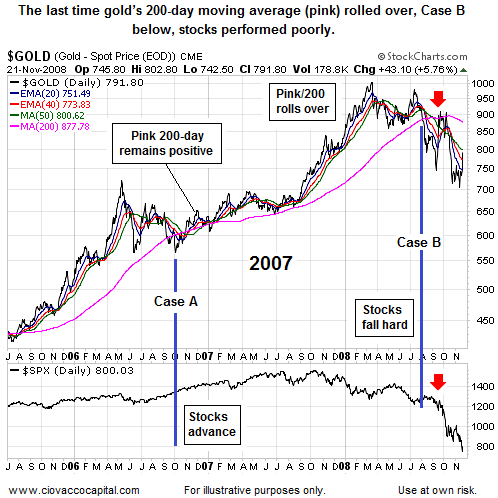
The chart below shows the last two times that (a) the price of gold broke below the 200-day MA and (b) some of the "faster" moving averages crossed below the 200-day. In Case A, the slope of gold's 200-day (pink) never rolled over in a negative manner. In Case A, stocks performed well after gold's bout of weakness (see bottom of chart in late 2006). In Case B, the slope of gold's 200-day did roll over in a bearish and deflationary manner. Stocks did not fare well (see red arrow lower right). As a reminder, gold's 200-day is trying to roll over in the present day, which looks more like Case B.
How can all this help us today? As long as the chart of gold remains in its current state (bearish 200-day/bearish moving average crossovers), we should manage all risk assets with care (from an intermediate-term perspective). If the slope of gold's 200-day regains a positive bias and buyers flock back to the yellow metal, it would send bullish signals for risk/inflation protection assets, including stocks. Looking at things from a bullish perspective, the daily chart of the gold miners ETF (GDX) completed a "bullish engulfing" candlestick pattern on May 9, which can be an early sign of a reversal in price.
If you question the gravity of the problem of too much debt, (a) ask yourself why the economy has remained so weak when interest rates have basically been at zero, and (b) watch this October 2011 video explaining the European debt crisis.
-
Copyright (C) 2012 Ciovacco Capital Management, LLC All Rights Reserved.
Chris Ciovacco is the Chief Investment Officer for Ciovacco Capital Management, LLC. More on the web at www.ciovaccocapital.com
Ciovacco Capital Management, LLC is an independent money management firm based in Atlanta, Georgia. As a registered investment advisor, CCM helps individual investors, large & small; achieve improved investment results via independent research and globally diversified investment portfolios. Since we are a fee-based firm, our only objective is to help you protect and grow your assets. Our long-term, theme-oriented, buy-and-hold approach allows for portfolio rebalancing from time to time to adjust to new opportunities or changing market conditions. When looking at money managers in Atlanta, take a hard look at CCM.
All material presented herein is believed to be reliable but we cannot attest to its accuracy. Investment recommendations may change and readers are urged to check with their investment counselors and tax advisors before making any investment decisions. Opinions expressed in these reports may change without prior notice. This memorandum is based on information available to the public. No representation is made that it is accurate or complete. This memorandum is not an offer to buy or sell or a solicitation of an offer to buy or sell the securities mentioned. The investments discussed or recommended in this report may be unsuitable for investors depending on their specific investment objectives and financial position. Past performance is not necessarily a guide to future performance. The price or value of the investments to which this report relates, either directly or indirectly, may fall or rise against the interest of investors. All prices and yields contained in this report are subject to change without notice. This information is based on hypothetical assumptions and is intended for illustrative purposes only. THERE ARE NO WARRANTIES, EXPRESSED OR IMPLIED, AS TO ACCURACY, COMPLETENESS, OR RESULTS OBTAINED FROM ANY INFORMATION CONTAINED IN THIS ARTICLE. PAST PERFORMANCE DOES NOT GUARANTEE FUTURE RESULTS.
Chris Ciovacco Archive |
© 2005-2022 http://www.MarketOracle.co.uk - The Market Oracle is a FREE Daily Financial Markets Analysis & Forecasting online publication.