


Combining the Andrews Lines with the W.D. Gann Head and Shoulders Pattern
InvestorEducation / Technical Analysis May 07, 2012 - 12:47 PM GMTBy: Submissions

 Ron Jaenisch writes: Both WD Gann and Alan Andrews used geometry and pattern recognition. Numerous articles and books have been written about both. Even though some of the techniques of Andrews and Gann are well known, there has been little discussion in combining the techniques. The advantages are significant. Gann techniques have a high probability and Andrews gives one the ability to enter the market with lower risk and significantly better risk reward ratios.
Alan Andrews stressed the importance of being a good steward of ones funds. To make the funds grow was doing Gods work, according to his writings. To that end Andrews stressed the importance taking high probability trades near the start of a long move.
In this article the focus is upon a very well known Gann pattern that is used by traders world wide. It is widely known for his head and shoulders technique.
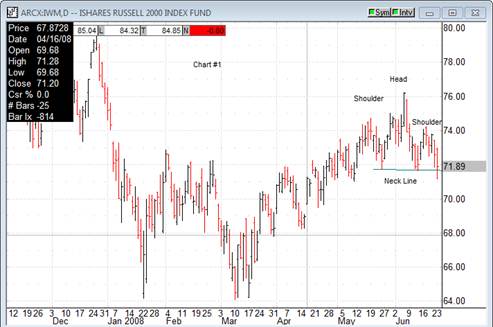
As can be seen in chart #1 the pattern is visible to the naked eye as prices are making the second shoulder. It is when prices break below the neck line that an entry signal is triggered by Gann rules.
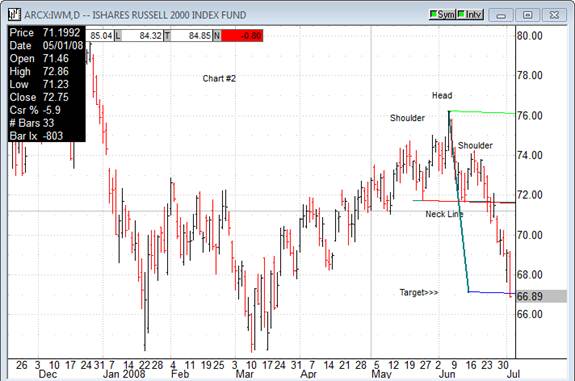
In chart #2, one can see that by using the neckline as a centerline and the tip of the head as the action line, the equidistant reaction line becomes the target under Gann concepts. The entry point is the break of the neckline and the target line is the trade exit point. For many traders it is the right shoulder that becomes the risk or stop loss area.
For advanced Andrews and Gann traders the static equidistant target line is not a probable turning point.
Using the entry point of prices going through the neckline, is responsible for the trade having a much less favorable risk reward ratio, than is possible by using Advanced Andrews concepts.
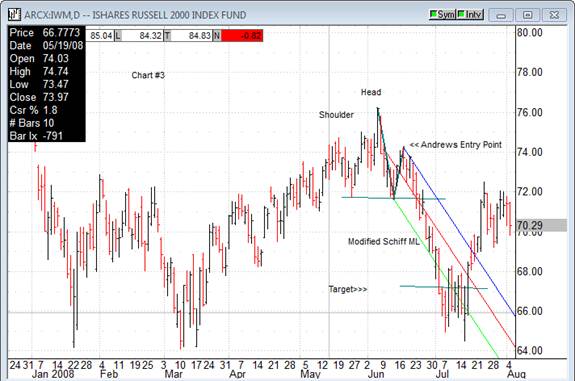
With the Advanced AndrewsCourse.com techniques one can often enter the market with an indicator like the golden pivot rule near the second shoulder. Then initially as a protective stop utilize the down sloping blue line in the Modified Schiff ML as seen in Chart #3.
But what about the target for the trade? By utilizing an effective understanding of the proper use of the Andrews concepts and the proper interpretation of price actions interaction with the Andrews Pitchfork the trade would exit for different reasons. In many cases this enables the trader to exit past the target line.
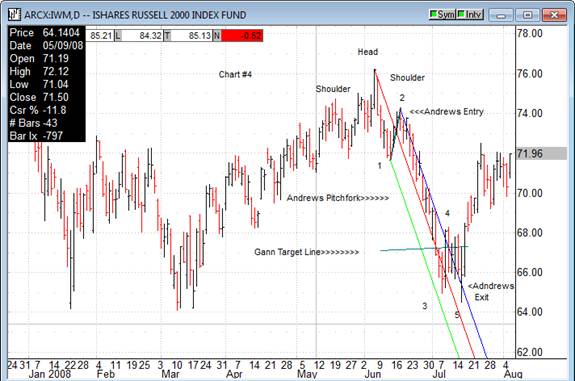
Andrews held that most moves had five or more pivots. The pivots in the down move are labeled in Chart #4. As you can also see, the normal Andrews pitchfork is drawn. If prices show divergence in their relationship to the Andrews lines, the move is often over.
Note that in chart #4 prices went past the red Median line as they made pivot 3 but could not reach the same line at pivot #5. The Andrews technique signals an exit.
Since many traders look for long signals in longer time frames, below are two examples with weekly charts in SPY. The same trading logic was applied, and as you can see the Andrews exit can occur prior to the Gann target.
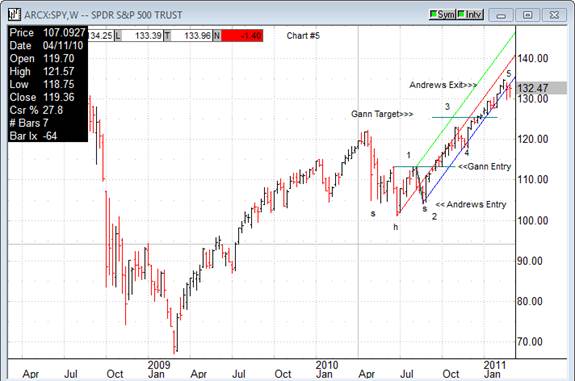
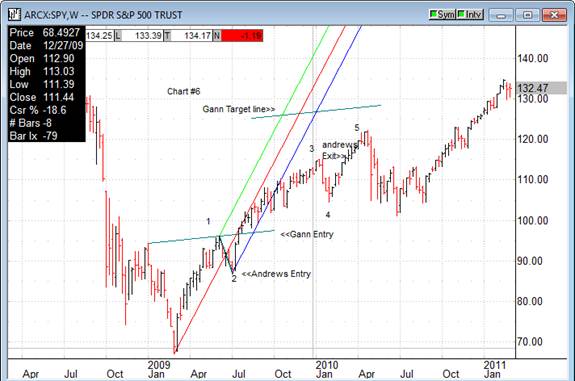
The end result of the extra work of including the Andrews lines and Advanced Andrews Course concepts is that one can achieve a more favorable risk reward ratio.
Andrews hidden geometry techniques can be used by themselves or to enhance Gann and other technical analysis methods
Ron Jaenisch has been trading for over 10 years and was a personal student of Alan Hall Andrews. He learned the techniques at private seminars given by Andrews and by personal instruction at the kitchen table. He offers a course that is taught with a manual, videos and a private email group.
To see a recent charts go to www.andrewscourse.com and click upon forecasts.
© 2012 Copyright Ron Jaenisch - All Rights Reserved
Disclaimer: The above is a matter of opinion provided for general information purposes only and is not intended as investment advice. Information and analysis above are derived from sources and utilising methods believed to be reliable, but we cannot accept responsibility for any losses you may incur as a result of this analysis. Individuals should consult with their personal financial advisors
© 2005-2022 http://www.MarketOracle.co.uk - The Market Oracle is a FREE Daily Financial Markets Analysis & Forecasting online publication.