


Gold Set for an Intriguing Week Ahead
Commodities / Gold and Silver 2012 May 06, 2012 - 09:04 AM GMTBy: Brian_Bloom

 Stockcharts.com has a technical tool that I’ve never used before – semicircle arrays which are intended to forecast Fibonacci retracement levels. In playing around with it, this is what I found:
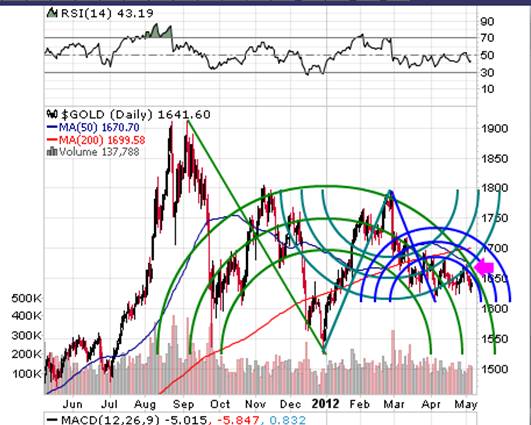
Note the first “green” trend line . When you join the top to the bottom, you get an array of semicircles which, presumably, represent price retracement resistance levels. (I did the same thing by joining the top to the first bottom in October, but am not including it here because it seemed less relevant and it clutters the picture).
Of particular interest with this array, is that the top of “Turquoise” trend line – which was drawn from the bottom in December to the top in late February, occurred at precisely the resistance level of the top green circle – which is why I decided that the green array was the relevant one.
But, in the act of drawing that turquoise trend line, it created a set of inverted turquoise semi-circles which represent support levels.
Further, the act of drawing in the next “blue” down trend line, created another set of blue circles – and it happened that the low point of that blue trend line coincided almost exactly with the level of the lowest turquoise semi circle.
In my experience, the more “coincidences” one finds when examining the charts, the more relevant is the overall picture that is emerging.
And here is the picture that emerged:
Have a look at where the pink arrow is pointing. It is pointing to the intersection of three semi-circles (top green semi circle, bottom turquoise semi circle and FIRST blue semi circle.
My reading of it is this:
The intersection of those three semicircles represents formidable resistance which, if it can be overcome, will see the gold price shoot up to around $1700 (the outside blue semicircle).
If that level of resistance can be overcome it will be a game changer and the gold price will enter a new bull phase.
By contrast, if the gold price fails to overcome the “formidable” resistance of these three semicircles, it will very probably fall swiftly to $1575, along an angle of decline that I drew in that is parallel to the green trend line – because by doing that, I was able to get the top pink semi circle to intersect at exactly the same point to which the pink arrow is pointing – see chart below.
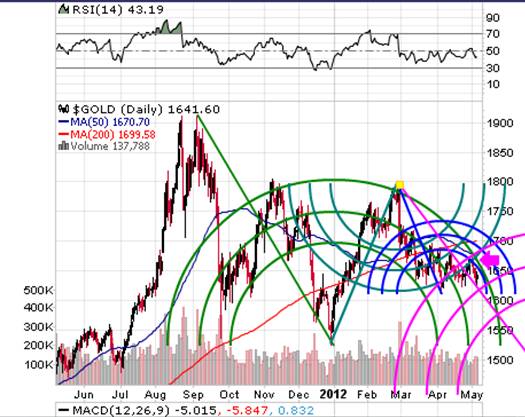
The assumptions that underlie the “logic” behind these semi circle arrays, is that human behaviour – like all other biological growth activity – follows predictable Fibonacci patterns. All I have done is I have extrapolated the patterns and tried to select those which are the relevant prevailing patterns.
So, whilst the above can’t predict whether the gold price will break up or down, the above analysis seems to be indicating that tension between bulls and bears has built to unsustainable levels. If the bulls prevail, then, at any price above $1700 we will see the gold price rising strongly. By contrast, failure to rise THIS COMING WEEK will probably see the gold price fall strongly.
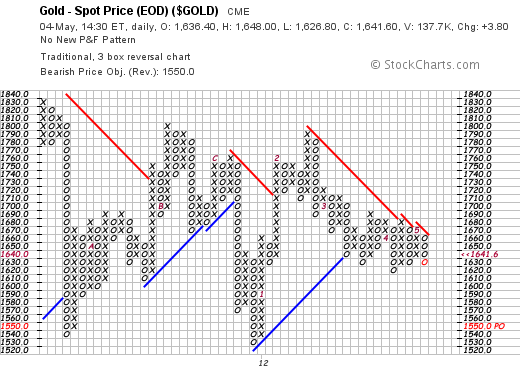
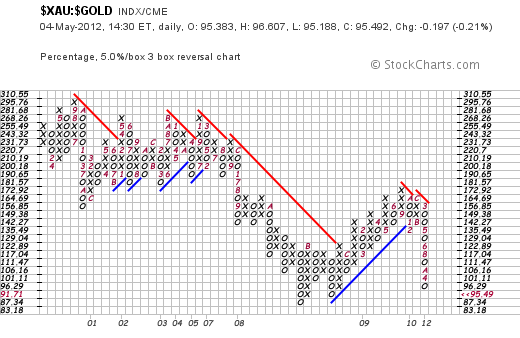
To jog the memories, the Point and Figure chart is in a clear bear trend (red trend line prevailing). It is forecasting that the break will be to the downside and that the first stop on the way down to $1109, will be $1550
To jog the memories further, the gold shares – which are highly leveraged to the gold price – have been falling faster than the gold price; and the gold shares are is in DEEPLY oversold territory relative to gold. This indicates that shareholders in gold mines have been anticipating that the gold price will not break up. The RS chart needs to rise – but because the shares are leveraged to the gold price – they need to rise faster than the gold price rises; much faster.
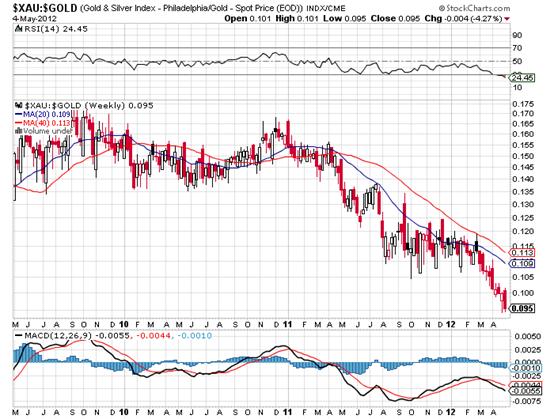
The probability of this happening if the gold price rises strongly seems low. It implies that there will be a reversal of the “low pole” in the chart below, driven by investors “panicking” into gold shares.
Of course, anything is possible. But a more reasonable cause of the low pole reversal might be that the gold price falls faster than gold shares as it plays catch-up.
Conclusion
The charts are suggesting that the uncertainties in the gold market will be resolved this coming week. Whilst the direction cannot be forecast with any degree of certainty, the balance of probabilities suggests that the break will be on the downside.
It will be very intriguing to watch the performance of the gold price in this coming week. Clearly, a break down will have significant implications regarding the potential for deflation to begin manifesting.
Caveat: Readers should bear in mind that the gold price is in a Primary Bull Trend. A break down will not imply that this Primary Trend will come under threat.
Brian Bloom
Author, Beyond Neanderthal and The Last Finesse
In the global corridors of power, a group of faceless men is positioning to usurp control of one of the world’s primary energy resources. Climate change looms large. Can the world be finessed into embracing nuclear energy? Set in the beautiful but politically corrupt country of Myanmar, The Last Finesse, through its entertaining and easy-to-read storyline, examines the issues of climate change, nuclear energy, the rickety world economy and the general absence of ethical behaviour in today’s world. The Last Finesse is a “prequel” to Beyond Neanderthal, which takes a right-brain, visionary look at possible ways of addressing the same challenges. The Last Finesse takes a more “left brain” approach. It is being published in all e-book formats.
Copyright © 2012 Brian Bloom - All Rights Reserved
Disclaimer: The above is a matter of opinion provided for general information purposes only and is not intended as investment advice. Information and analysis above are derived from sources and utilising methods believed to be reliable, but we cannot accept responsibility for any losses you may incur as a result of this analysis. Individuals should consult with their personal financial advisors.
Brian Bloom Archive |
© 2005-2022 http://www.MarketOracle.co.uk - The Market Oracle is a FREE Daily Financial Markets Analysis & Forecasting online publication.