Five Healthy Dividend Growth Stocks to Cure What Ails Your Portfolio
Companies / Dividends May 04, 2012 - 01:48 AM GMTBy: Fast_Graphs
 These five above-average growing opportunities in the healthcare sector provide dividend growth investors potential alternatives to the traditional large-cap pharmaceuticals. This is a high quality group of healthcare companies that possess above-average growth potential plus an above-average dividend yield that is expected to grow at above-average future rates. Consequently, we believe these candidates offer the total package. We believe that each of these nontraditional healthcare opportunities are attractively valued, provide an attractive dividend, and the opportunity for above-average total return.
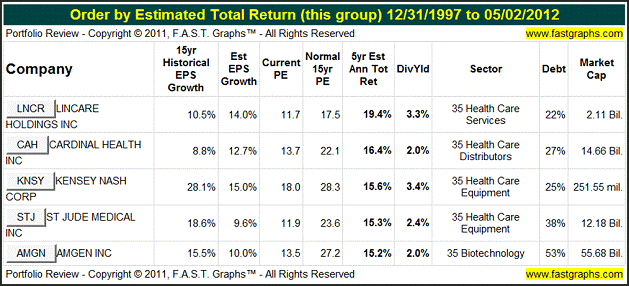
The following table summarizes Five Healthcare Dividend Growth Stocks that appear to be attractively valued, and lists them in order of Estimated Total Return. From left to right, the table shows the company’s stock symbol and name. Next the company’s historical EPS growth followed by the estimated EPS growth. Next you will find the current PE ratio followed by the historical normal PE ratio for perspective. Then the 5-year estimated annual total return, followed by dividend yield for each company. The final three columns show the company sector, debt, and its market cap.
A Closer Look at the Past and the Future Potential
Since a picture is worth 1,000 words, we’ll take a closer look at the past performance and future potential of each of our five candidates through the lens of F.A.S.T. Graphs™.
Earnings Determine Market Price: The following earnings and price correlated historical graphs clearly illustrates the importance of earnings. The Earnings Growth Rate Line or True Worth™ Line (orange line with white triangles) is correlated with the historical stock price line. On graph after graph the lines will move in tandem. If the stock price strays away from the earnings line (over or under), inevitably it will come back to earnings. The historical normal PE ratio line (dark blue line with*) depicts a PE ratio that the market has historically applied.
The orange True Worth™ line and the blue normal PE ratio line provide perspectives on valuation. The orange line reflects the fair value of each company’s earnings relative to its growth rate achievement, and the blue line reflects how the market has traditionally valued the company’s stock relative to its fair value. The blue line represents a trimmed historical normal PE ratio (the highest and lowest PEs are trimmed). These lines should be viewed as barometers or aids for ascertaining sound buy, sell or hold decisions. Rather than seen as absolutes, they should be seen as guides to better thinking.
About Lincare Holdings Inc (LNCR): Directly from their website
“Lincare, headquartered in Clearwater, Florida, is one of the nation's largest providers of respiratory therapy and other services to patients in the home. The Company provides services and equipment to more than 750,000 customers in 48 states through 1,071 local centers.”
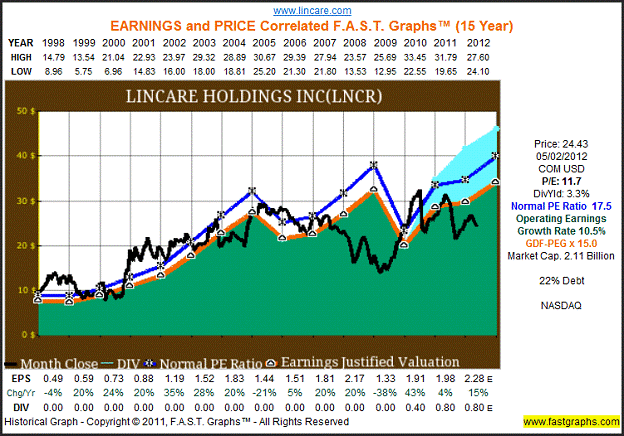
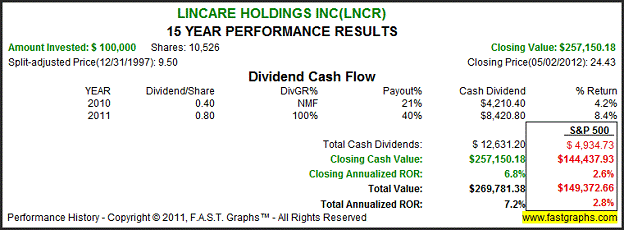
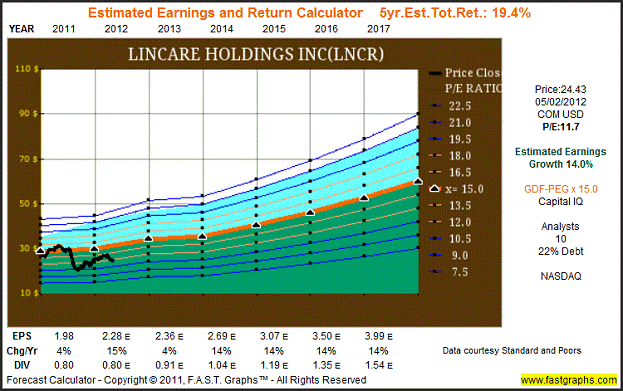
The consensus of 10 leading analysts reporting to Capital IQ forecast Lincare Holdings Inc’s long-term earnings growth at 14%. Lincare Holdings Inc has low long-term debt at 22% of capital. Lincare Holdings Inc is currently trading at a P/E of 11.7, which is below the value corridor (defined by the five orange lines) of a maximum P/E of 18. If the earnings materialize as forecast, Lincare Holdings Inc’s True Worth™ valuation would be $59.86 at the end of 2017, which would be a 19.4% annual rate of return from the current price.
About Cardinal Health Inc (CAH): Directly from their website
“Headquartered in Dublin, Ohio, Cardinal Health, Inc. (NYSE: CAH) is a $103 billion health care services company that improves the cost-effectiveness of health care. As the business behind health care, Cardinal Health helps pharmacies, hospitals, ambulatory surgery centers and physician offices focus on patient care while reducing costs, enhancing efficiency and improving quality. Cardinal Health is an essential link in the health care supply chain, providing pharmaceuticals and medical products to more than 60,000 locations each day. The company is also a leading manufacturer of medical and surgical products, including gloves, surgical apparel and fluid management products. In addition, the company supports the growing diagnostic industry by supplying medical products to clinical laboratories and operating the nation's largest network of radiopharmacies that dispense products to aid in the early diagnosis and treatment of disease. Ranked #19 on the Fortune 500, Cardinal Health employs more than 30,000 people worldwide.”
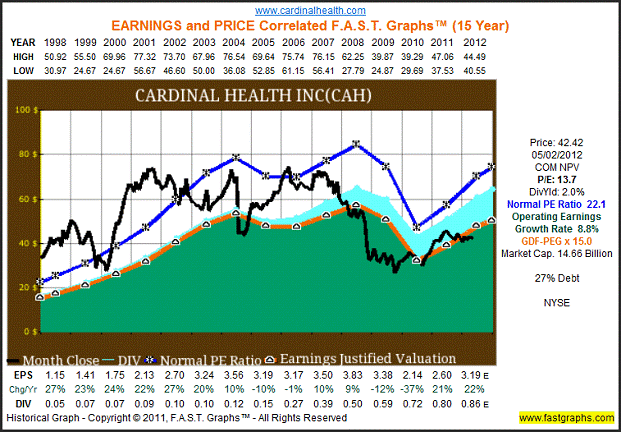
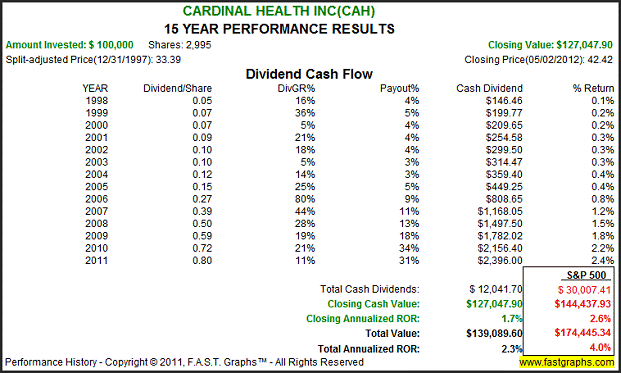
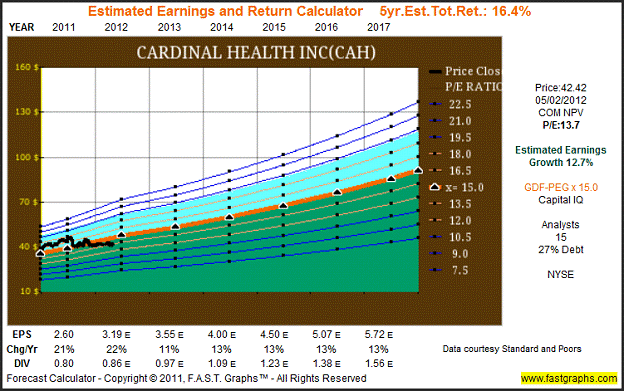
The consensus of 15 leading analysts reporting to Capital IQ forecast Cardinal Health Inc’s long-term earnings growth at 12.7%. Cardinal Health Inc has medium long-term debt at 27% of capital. Cardinal Health Inc is currently trading at a P/E of 13.7, which is inside the value corridor (defined by the five orange lines) of a maximum P/E of 18. If the earnings materialize as forecast, Cardinal Health Inc’s True Worth™ valuation would be $85.75 at the end of 2017, which would be a 16.4% annual rate of return from the current price.
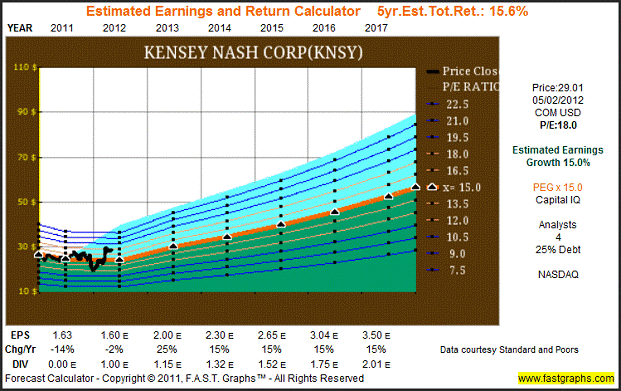
About Kensey Nash Corp (KNSY): Directly from their website
“Kensey Nash is a medical device company primarily focused on regenerative medicine utilizing its proprietary collagen and synthetic polymer technology. Kensey Nash is recognized as a leader for innovative product development and unique technology in the field of resorbable biomaterials. Kensey Nash has an extensive range of products, which are sold through strategic partners in multiple medical markets, including the cardiology, orthopaedic, sports medicine, spine, trauma, craniomaxillofacial and general surgery markets.”
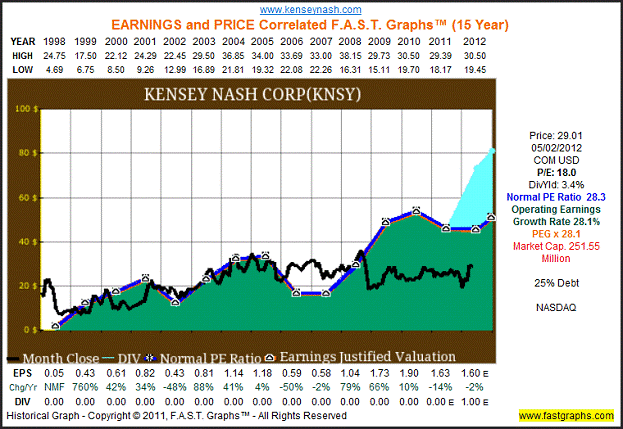

The consensus of 4 leading analysts reporting to Capital IQ forecast Kensey Nash Corp’s long-term earnings growth at 15%. Kensey Nash Corp has low long-term debt at 25% of capital. Kensey Nash Corp is currently trading at a P/E of 18, which is inside the value corridor (defined by the five orange lines) of a maximum P/E of 18. If the earnings materialize as forecast, Kensey Nash Corp’s True Worth™ valuation would be $52.47 at the end of 2017, which would be a 15.6% annual rate of return from the current price.
About St Jude Medical Inc: Directly from their website
“St. Jude Medical develops medical technology and services that focus on putting more control into the hands of those who treat cardiac, neurological and chronic pain patients worldwide. The company is dedicated to advancing the practice of medicine by reducing risk wherever possible and contributing to successful outcomes for every patient. St. Jude Medical is headquartered in St. Paul, Minn. and has four major focus areas that include: cardiac rhythm management, atrial fibrillation, cardiovascular and neuromodulation.”
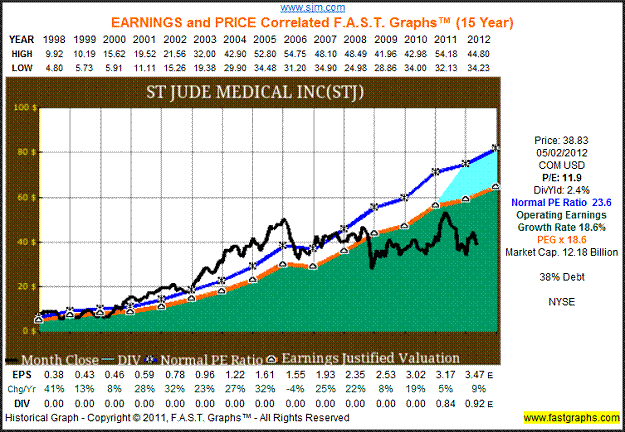
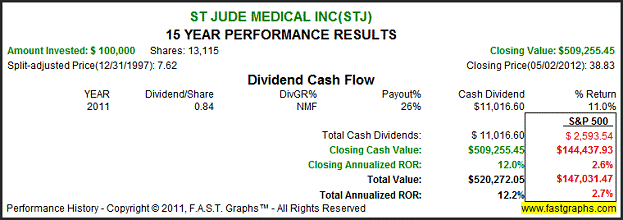
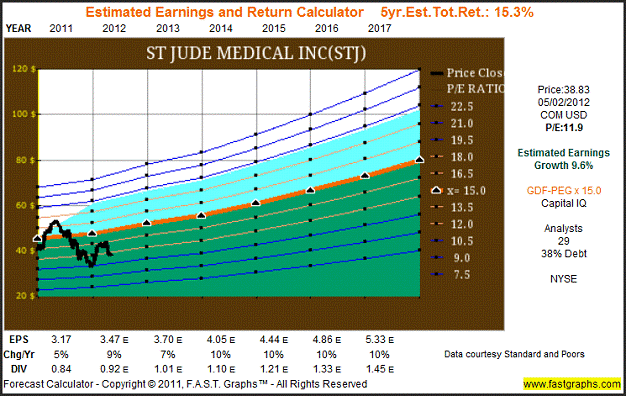
The consensus of 29 leading analysts reporting to Capital IQ forecast St Jude Medical’s long-term earnings growth at 9.6%. St Jude Medical has medium long-term debt at 38% of capital. St Jude Medical is currently trading at a P/E of 11.9, which is below the value corridor (defined by the five orange lines) of a maximum P/E of 18. If the earnings materialize as forecast, St Jude Medical’s True Worth™ valuation would be $79.94 at the end of 2017, which would be a 15.3% annual rate of return from the current price.
About Amgen Inc (AMGN): Directly from their website
“Amgen discovers, develops, manufactures and delivers innovative human therapeutics. A biotechnology pioneer since 1980, Amgen was one of the first companies to realize the new science's promise by bringing safe, effective medicines from lab to manufacturing plant to patient. Amgen therapeutics have changed the practice of medicine, helping millions of people around the world in the fight against cancer, kidney disease, rheumatoid arthritis, bone disease and other serious illnesses. With a deep and broad pipeline of potential new medicines, Amgen remains committed to advancing science to dramatically improve people's lives.”
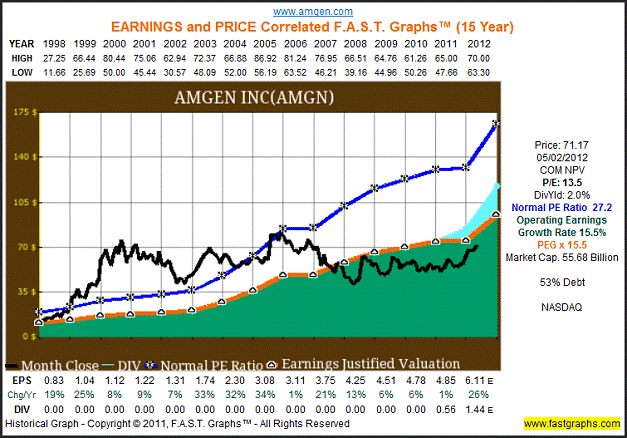
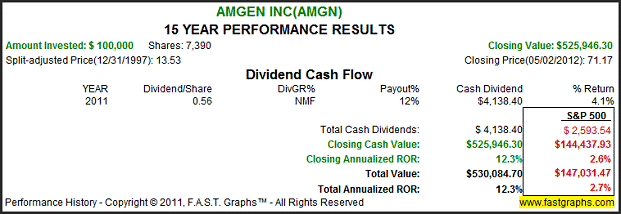
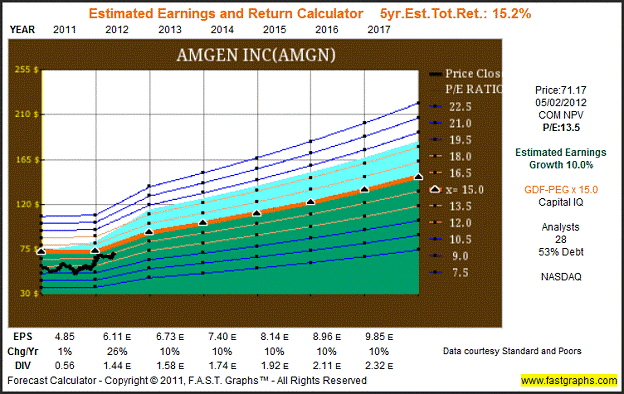
The consensus of 28 leading analysts reporting to Capital IQ forecast Amgen Inc’s long-term earnings growth at 10%. Amgen Inc has medium long-term debt at 53% of capital. Amgen Inc is currently trading at a P/E of 13.5, which is inside the value corridor (defined by the five orange lines) of a maximum P/E of 18. If the earnings materialize as forecast, Amgen Inc’s True Worth™ valuation would be $147.80 at the end of 2017, which would be a 15.2% annual rate of return from the current price.
Summary and Conclusions
The healthcare industry represents a significant opportunity for long-term growth thanks to an aging population. However, there are also many challenges facing the industry due to high cost and regulatory scrutiny. Nevertheless, we believe the five candidates listed in this article are well-positioned to be part of the healthcare solution rather than part of the problem. Although these are not your traditional healthcare companies, we do believe that they are well-positioned to prosper during the forthcoming healthcare environment and challenges.
Therefore, we believe these companies possess the opportunity for above-average long-term growth of both capital and dividend income. As you review each company, note that several have just begun a dividend policy. Therefore, they do not possess long histories of dividend excellence that many dividend growth investors covet. On the other hand, due to their expected above-average growth and above-average market yields we believe that they do offer the potential for strong total returns. On the other hand, we believe their potential for an increase in dividend income stream is excellent as well. As always, we recommend you conduct your own thorough due diligence.
Disclosure: No positions at the time of writing.
By Fast Graphs
Disclaimer: The opinions in this document are for informational and educational purposes only and should not be construed as a recommendation to buy or sell the stocks mentioned or to solicit transactions or clients. Past performance of the companies discussed may not continue and the companies may not achieve the earnings growth as predicted. The information in this document is believed to be accurate, but under no circumstances should a person act upon the information contained within. We do not recommend that anyone act upon any investment information without first consulting an investment advisor as to the suitability of such investments for his specific situation.
© 2005-2022 http://www.MarketOracle.co.uk - The Market Oracle is a FREE Daily Financial Markets Analysis & Forecasting online publication.


