Lindsay: No Final Bottom in Gold before Summer
Commodities / Gold and Silver 2012 May 04, 2012 - 01:39 AM GMTBy: Submissions
 Ed Carlson writes: In the course of a █year career George Lindsay never applied his methods to anything other than the equity markets. The reasons were obvious; the Standard Time Spans, an integral part of his methods, were derived from a study of the equity markets covering more than 150 years of market data. An undertaking such as that would have been exhausting. No doubt, Lindsay left the investigation and application of his methods to other asset classes for other analysts.
Subscribers at SeattleTA know we have been applying Lindsay’s methods to gold since our forecast for a high in the gold market last September. At that time we believed, given the high correlation between asset classes, the odds were predisposed for a favorable outcome. We warned readers that once correlations break down (and they will) Lindsay’s methods may no longer apply to asset classes other than equities without someone spending the time (years) to derive a set of Standard Time Spans for each asset class of interest. But, until that happens, we will endeavor to apply Lindsay’s methods, albeit with a bit more license than we would normally be apt to grant, to gold.
Long-term Intervals
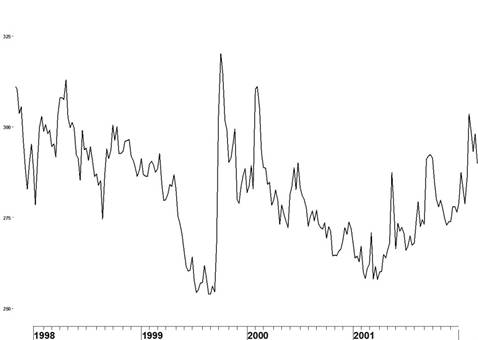
For more than a decade an important bottom could have been expected for early this year. Lindsay targets significant bottoms using a 12-year interval. A 12-year interval extends from a significant high to a time interval, 12years, 2months to 12years, 8months, into the future. It is within this 6-month interval that we expect to find an important low.
Looking into the past we see a significant high on 10/5/99. Our recent low in gold on 12/30/11, 12years, 2months from the 1999 high, clearly falls within the time frame for an important low – as does any low between then and June of this year.
The reader may thus ask, ‘was last December the low in gold?’ Fortunately, Lindsay left us other methods to narrow down this long-term forecast to something more manageable; primarily the Standard Time Spans.
Standard Time Spans
We use the Basic Movements (Basic advances and Basic declines) to time both important and intermediate highs and lows. The genius of Lindsay was his discovery that all advances and declines tend to cluster together into groups of similar duration. He called these groups the Standard Time Spans. To find the next significant low we must find a Basic decline which fits into one of the Standard Time Spans and terminates within the time target set by our 12year interval (December 2011 – June 2012). Two questions arise: from where do we count this Basic decline and how long are the Standard Time Spans?
When counting to an important low, we count from an important high. At the time of this article, we can see (with perfect, 20/20 hindsight) that the highs of August and September 2011 were important highs in gold; 8/22/11 was the closing high of the previous advance and 9/6/11 was the intraday high. Two possible starting dates makes our task marginally more involved but the bottom line is that Lindsay would have used whichever high seemed to work the best.
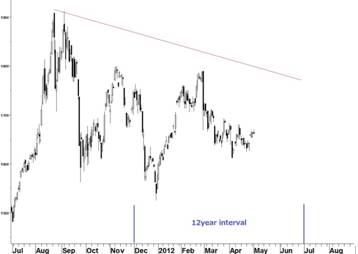
The time span of a Short Basic decline extends 317-364 days. Counting from 8/22/11, this time span forecasts a low sometime during 7/4/12 – 8/20/12. But our 12year interval has told us to expect a bottom before the end of June! Does that mean last December’s low was the important low? There have been instances of a 12year interval extending to 12years, 9months and even two instances of 12years, 10months (in the last 100years). But the farther we extend the 12year interval, the more we lessen the probability of being correct. Hence, we will exclude the range counted from 9/6/11 (7/19/12 – 9/4/12). We can also see there is no need to count a Long Basic decline (376-446days). At this point it is probably proper to reiterate that the Standard Time Spans were based on equities, not gold so we should probably give them a bit of leeway here. ‘So’, as the man said ‘what else have you got in your bag of tricks?’
Counts from the Middle Section
In 1950, Lindsay published “An Aid to Timing” a brochure (or paper) which described his first original discovery about market timing; Counts from the Middle Section. It was the success he experienced with this publication that convinced him to start his own advisory service. A Middle Section is a period in a bull market when the rate of advance tends to slow down. Equities advance at a faster rate both before and after this ‘middle section’ – hence the name.
We typically take our count from point E – the second-to-last high in the Middle Section – to the top of the current bull market or to the bottom of the succeeding bear market. The analyst then counts forward a like number of days in expectation of a market low (counted from the bull market top) or a market high (counted from the bear market low).
Point E of the late-2010 Middle Section falls on 11/9/10. Counting the distance between then and the intraday market top on 9/6/11 is 301 days. Counting forward another 301 days takes us to 7/3/12 – one day before the beginning of the interval defined by our Short Basic decline. Why do we count our Middle Section to and from 9/6/11 rather than 8/22/11? Counting to-and-from 8/22/11 (286days) takes us to Sunday, June 3 2012. We believe late-May/ early-June to be a high, not a low, and will return to that later.
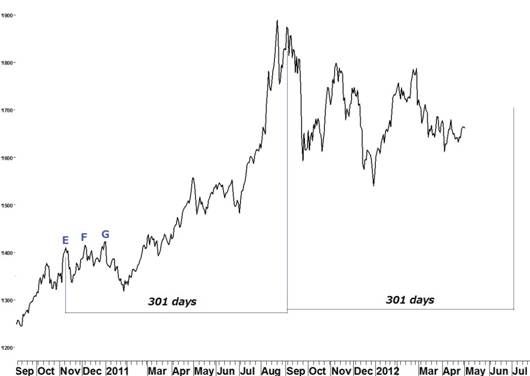
So late June - early July is looking like a probable ‘important’ low. Confidence can be gained, however, by understanding the highs and lows that came before it. Let’s take a look at those inflection points.
Gold Top 2011
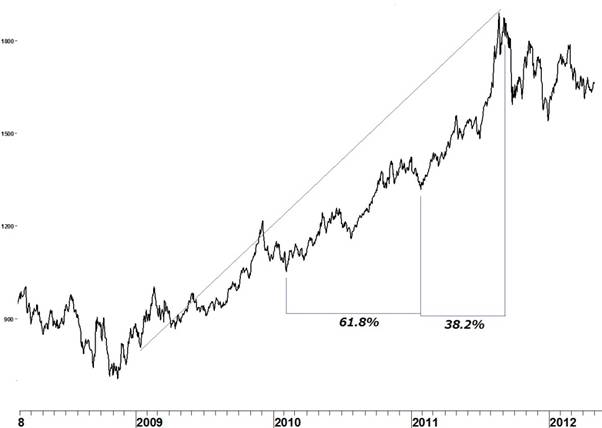
Assuming the distance between the lows of 2/5/10 and 1/28/11 was 61.8% of a move from 2/5/10 to a top, these counts targeted the 9/6/11 intraday high perfectly. This approach is identical to Lindsay’s Low-Low-High intervals (Lindsay Timing Model) except that it uses Fibonacci time spans rather than absolute counts. Counting an Extended Basic advance (929-968days) from the 1/15/09 low works for either the August (949 days) or September (964days), 2011 highs but would seem to violate our guideline that important highs and lows are counted to each other. Although the 1/15/09 low is not an important low, it is the beginning of an advance from a ‘Sideways Movement’ which is both very rare and beyond the scope of this article.
12/29/11 Low
The 12/29/11 low is our first look at an intermediate inflection point rather than the important market highs and lows we have been focusing on until now. Another Middle Section appears in the spring and summer of 2011. Counting from point E on 5/11/11 to the intraday high on 9/6/11 is 118 days. Counting forward another 118 days takes us to Monday, 1/2/12. Markets were closed on that day and gold bottomed two trading days previously on 12/29/11. Was that the important low most gold traders would be interested in?
Allowing for the longest possible interval by counting the Basic decline from the August (rather than September) high, we count a period of only 129days. 129days is not long enough for even a subnormal decline (222-250days) so we must exclude the December low as a possible end to the basic decline and conclude it is not the important low we are looking for. The low of 12/29/11 is counted as a Long Basic decline (376-446days) of 387days from the intermediate high of 12/7/10 and hence an intermediate low
Where is the bottom?
 We are expecting one final run-up, a sucker’s rally, before gold has its ‘Thelma and Louise’ moment.
We look for a final high in gold during the final week of May. Our point target is 5/31/12. May 31st is an exact 107 days from the Key Date of 2/14/12. 107 days is 38.2% of the total distance to the important low of 8/25/11. May 31st, at 224 days from the low of 10/20/11, fits what we call a 221-day interval (215-225days). Finally, point E of our 2011 Middle Section counts 194 days to the low on 11/21/11. Counting forward, another 194 days, targets a high on Saturday, June 2, 2012.
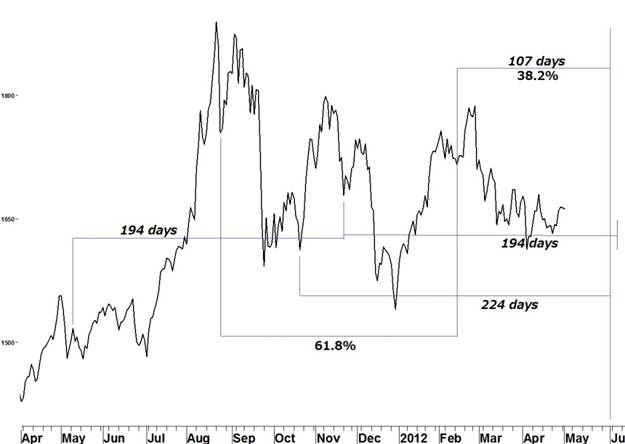
Our point forecast for a bottom in gold is 7/3/12. To recap, counting from 11/9/10 (point E in the late 2010 Middle Section) is 301 days until the 9/6/11 high. Counting 301days from 9/6/11 targets a bottom on 7/3/12. But will 7/3/12 be the “important” low we’re looking for and not just another low? 8/2/11 until 7/3/11 is 316days and is one day short of a Short Basic decline (317-364days). Again, given these time spans were based on equities we feel fine giving them one day leeway. Our 12year interval (December 2011 – June 2012) argues against extending our count any farther. 7/3/12 is also a 221-day interval (225days in this case) from the low of 11/21/11. We can find reasons to allow a window of up to 5 days prior to our point forecast as our range forecast for a low in gold.
Bio
Ed Carlson, author of George Lindsay and the Art of Technical Analysis, is an independent trader, consultant, and Chartered Market Technician (CMT) based in Seattle, Washington. Carlson hosts the MTA Podcast Series: Conversations and is a contributor to Technical Analysis of Stocks and Commodities and SFO Magazines. He also manages the website Seattle Technical Advisors.com, where he publishes daily and weekly commentary. He spent twenty years as a stockbroker and holds an M.B.A. from Wichita State University.
© 2012 Copyright Ed Carlson - All Rights Reserved Disclaimer: The above is a matter of opinion provided for general information purposes only and is not intended as investment advice. Information and analysis above are derived from sources and utilising methods believed to be reliable, but we cannot accept responsibility for any losses you may incur as a result of this analysis. Individuals should consult with their personal financial advisors.
© 2005-2022 http://www.MarketOracle.co.uk - The Market Oracle is a FREE Daily Financial Markets Analysis & Forecasting online publication.


