The Dividend Aristocrats Found The Lost Decade
Companies / Dividends May 01, 2012 - 12:25 PM GMT There are many people who continue to hold a jaundiced view of stocks because they were traumatized by the last two recessions. Precipitous drops in equity prices drove them to distrust stocks and stock markets. However, I believe that most of the negative sentiment is a function of what I would describe as vague ideas about what really happened. A lot has to do with many investors failing to recognize, or make the important distinctions, that were the true causes of our last two market crashes.
The first market collapse (late summer 2000) was first a function of significant overvaluation, especially regarding the technology sector, followed by the mild recession of 2001. The second market collapse was the result of a greedy and fraudulently induced, and consequently, more serious recession dubbed the great recession of 2008. Therefore, at least in my opinion, the two huge drops in stock values were not really the result of a weak economy, as many people think. The first was the result of an extremely inefficiently behaving stock market, and the second, the result of a greedy financial sector induced by poor government policy.
Nevertheless, these two major catastrophic events have shaken the confidence of many investors. What bothers me about this is how it is driving people away from investing in our country's finest companies at precisely the time when I believe that it makes more sense to do so than it has in many years. Most importantly, the conditions that existed when these two market collapses occurred no longer exist. Nevertheless, investors and pundits alike, continue to look for reasons why a market collapse will soon reoccur. Their views are based on a pessimistic view of equities, and I believe an exaggerated view of the risk profile of stocks that was caused by the trauma.
Personally, I abhor pessimism, because I believe it is both an erroneous and dangerous mindset for investors to possess. In a recent article, I mistakenly titled my introduction "pessimism is for losers" and therefore, inadvertently offended many readers. Although I accept the responsibility that it was my fault for penning such a provocative statement, the offended readers misunderstood my intent. I was not calling pessimistic people losers; I was attempting to articulate that a pessimistic attitude can create unnecessary losses.
Furthermore, many readers also mistook my words to mean that I was a "perma Bull" that was in denial that a future market collapse could even occur. That is not what an optimistic attitude is actually about. An optimistic attitude is about understanding and believing that even though a recession or market collapse can occur, both will inevitably end. Therefore, both our equity markets and our economy will prosper and grow once again; it's only a matter of time.
But the real problem is that pessimists are most likely to sell at the bottom of the market and as a result realize unnecessary losses. Market bottoms have always represented great buying opportunities, that only an optimist is capable of exploiting. More simply stated, people usually sell their equities when the risk of owning them is the lowest and the opportunity for gain the highest. In other words, selling into the bottom of the market instead of buying into it as the optimist does.
Since 2000 Dividend Aristocrats Outperformed the S&P 500
I have come to learn that Dividend Growth investors, which have also been disparagingly referred to as Dividend Zealots, are among the most optimistic investors in the universe. And in many ways, perhaps the most misunderstood. Dividend Growth investors often state that they are not concerned with drops in the price of their stocks, but only that their dividends grow. For some reason, this offends certain people who apparently feel that this makes Dividend Growth investors arrogant and/or even ignorant.
What these detractors misunderstand in my judgment, is that the average Dividend Growth investor does not worry about short-term volatility because they do not intend to sell. Dividend Growth investors buy in order to hold quality dividend paying companies for the long run, that have long histories of increasing their dividends every year. There are two popular sources of identifying the consistent dividend achiever. They are the lists of Dividend Champions, Contenders and Challengers provided by David Fish found here, and perhaps the more widely known Standard & Poor's Corp's Dividend Aristocrats. Both the Dividend Champions and Dividend Aristocrats are comprised of companies that have increased their dividends for at least 25 consecutive years.
Since there are fewer names on the Dividend Aristocrats than there are the Dividend Champions (51 versus 103), I took the easy route and calculated the returns of the Dividend Aristocrats since calendar year 2000. Although we are now into our 13th year, thus going three years beyond the so-called "Lost Decade", the evidence of rebounding stock values is profoundly obvious. Not only did all but three of the Dividend Aristocrats dramatically outperform the S&P 500, they also provided very strong returns, that on balance, out-stripped inflation and even taxation.
I was motivated to run this study because of a comment that one reader made on my article (link provided above) as follows:
"The average S&P 500 index fund is down roughly 28% since 1/1/2000, after adjusting for inflation. Add in dividends and that gets investors to nearly the breakeven point. Subtract the funds taxes from Gains and dividends, and investors are back to a loss."
The same commenter also expressed the same sentiment in another comment to another reader as follows:
"it is likely that nearly all the dividend buy- and- hold Bulls have lost money relative to year 2000, after adjusting for inflation and taxes."
Although the first comment above is accurate regarding the S&P 500 as inflation was approximately 28% (by my calculation inflation was actually 32.3%), his second comment is inaccurate where his view is biased by his first comment. In truth, at least regarding the Dividend Aristocrats who increased their dividend every year for 25 straight years, all the dividend buy-and-hold bulls that held them would have trounced the S&P, inflation and taxes.
The following tables generated by the F.A.S.T. Graphs™ research tool reviews the performance of the Dividend Aristocrats since December 31, 1999. Astoundingly, only 3 of the 51 Dividend Aristocrats underperformed the S&P 500. Furthermore, only 7 of the 51 companies would have failed to generate the 3% compounded annual return necessary to combat inflation and taxes. Moreover, the majority of the Dividend Aristocrats have lavishly rewarded their dividend buy-and-hold bulls (optimists). As you review the list, note that every company from Procter & Gamble (PG) and above outperformed the S&P 500, inflation and taxes.
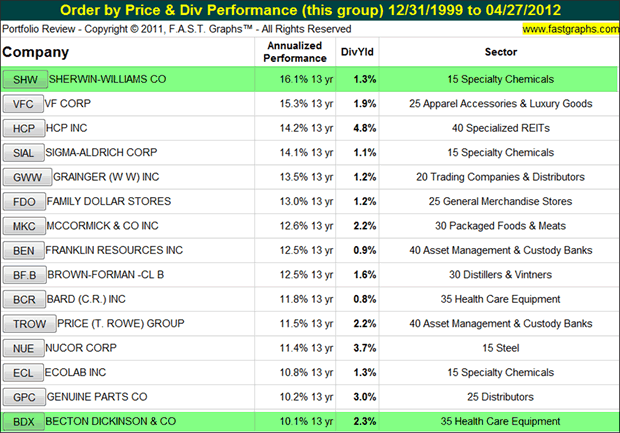
Table One: Top 15 Dividend Aristocrats Since 1999
Our first table lists the top 15 Dividend Aristocrats in order of highest performing to the lowest. Sherwin Williams (SHW), the best performer averaged over 16% returns per annum, with Becton Dickinson & Co. (BDX) rounding out the top 15 by averaging a 10.1% compounded annual return.
As you review the records of these first 15 Dividend Aristocrats, keep in mind that this is during one of the worst 13-year periods of price performance in stock market history. For added perspective and insight and just following this first table, I provide the complete earnings and price driven F.A.S.T. Graphs™, plus performance tables on these two Dividend Aristocrats.
Sherwin-Williams Co.
There are at least two very interesting takeaways that the 13-year earnings and price correlated graph on Sherwin-Williams reveals. First of all, Sherwin-Williams was not overvalued at the beginning of calendar year 2000. This validates a point that I've often written about that states that in every market, whether bull or bear, the scrutinizing investor can always find good stocks at fair value to invest in. Second, I would like to point out that I believe that Sherwin-Williams is currently significantly overvalued, which greatly contributes to its outperformance.
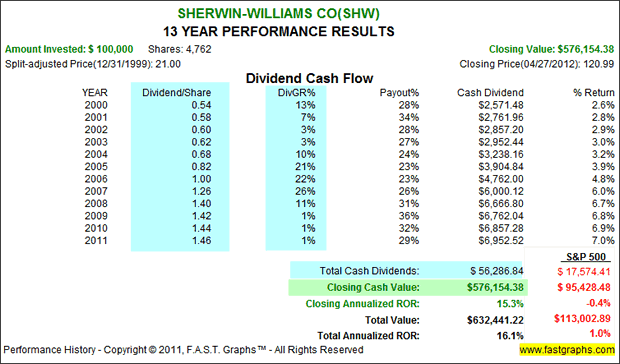
There was no "Lost Decade" for shareholders of Sherwin-Williams Company since 1999. Not only did they receive significant long-term capital appreciation, they were rewarded by strong growth in their dividend income. Finally, what follows is a napkin calculation of Sherwin-Williams' return after inflation and taxes:
$576,154.38 capital appreciation - 33% inflation = $386,203 + $56,287 of total dividends paid - 15% tax = $47,844 = $329,916 total cash return (The figure needed to beat inflation is approximately $133,000).

Becton Dickinson & Co. (BDX)
Becton Dickinson is also interesting in at least two ways. First, it represents another example of a company that was fairly valued at the beginning of calendar year 2000. However, it was overvalued in 2008, which contributed to their large drop in stock price during the great recession. But even though they have not returned to their previous high price of $93.24 in 2008, fair value at that time was approximately somewhere between $65-$70 per share. In other words, Becton Dickinson's stock price should never have been that high in the first place. As an aside, even the optimistic investor should have, or could have, realistically sold or lightened up on their position at that time.
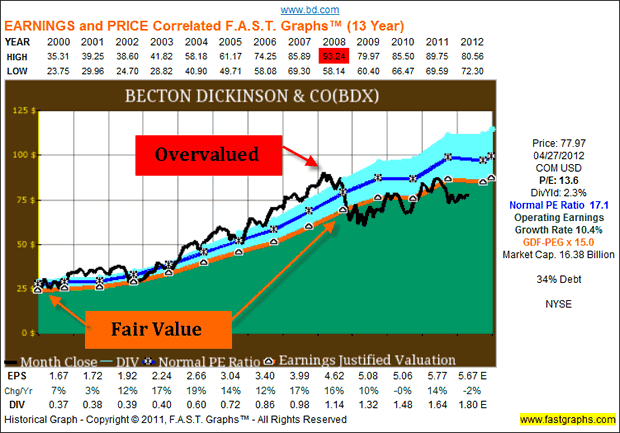
The scrutinizing reader might notice that Becton Dickinson shareholders enjoyed a total rate of return (10.1%) that was very close to its operating earnings growth rate of 10.4%. At the end of the day, fundamentals matter. Also, note that dividends increased in close correlation with earnings growth.
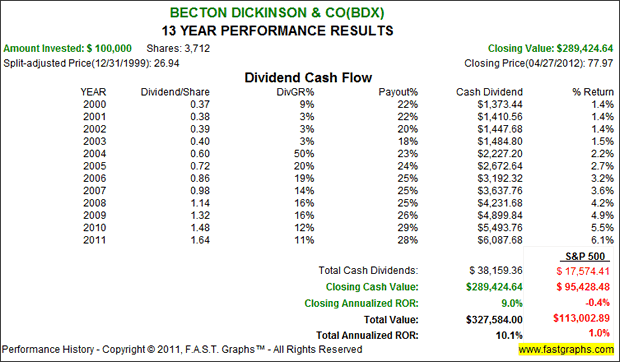
Table Two: Top Performing Dividend Aristocrats 16 - 30
Our second top 15 best performing Dividend Aristocrats also soundly outperformed the S&P 500, inflation and taxes.
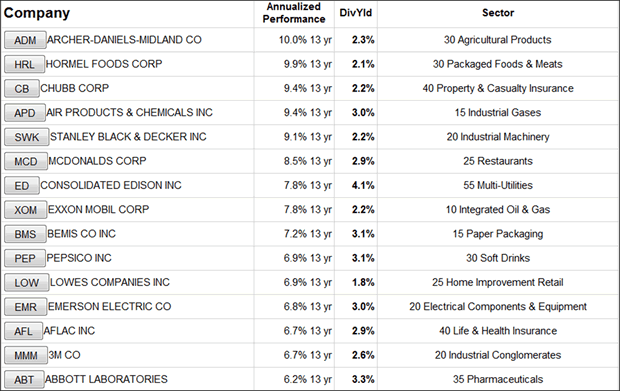
Table Three: Top Performing Dividend Aristocrats 31 - 45
On this list of Dividend Aristocrats, only one company, Walgreen Co. (WAG) did not outperform the S&P 500, inflation and taxes.
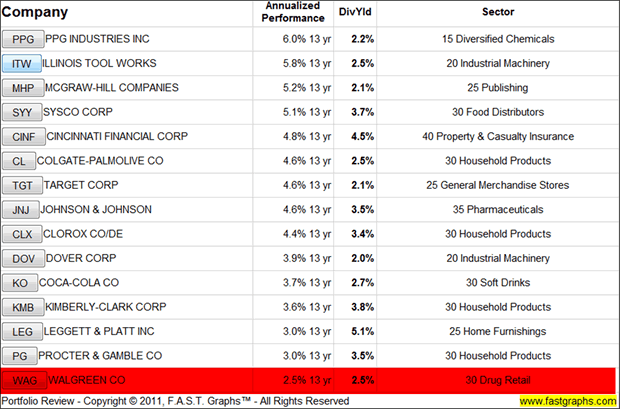
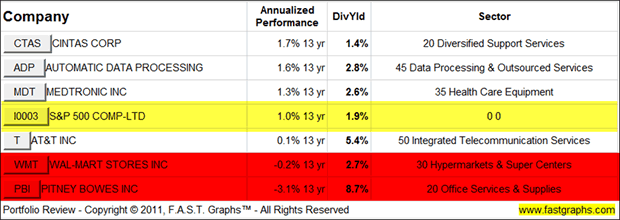
Table Four: Final Six Lowest Performing Dividend Aristocrats
Only 3 of our final 6 of 51 Dividend Aristocrats failed to outperform the S&P 500 since December 31, 1999. Technically, none of these final six would have outstripped inflation or taxes either. However, only two of the six would have actually generated a real loss, excluding inflation and taxes. However, the reasons why are fascinating, and are reviewed in detail following the table.
Wal-Mart Stores Inc. (WMT)
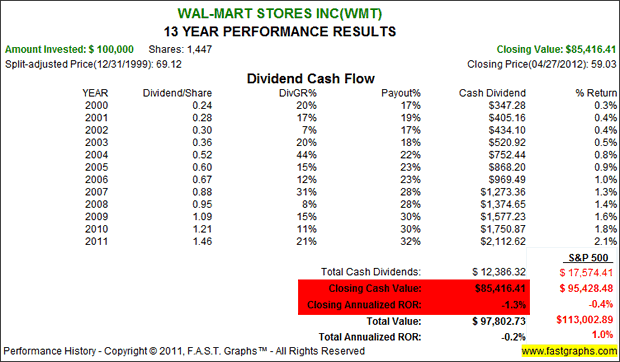
Our next to last worst-performing Dividend Aristocrat was Wal-Mart, which tells a very interesting story about stock market inefficiency. Clearly, the company was significantly overvalued at the beginning of calendar year 2000. However, the reader should also note that this company grew earnings at above-average rates through both the recession of 2001 and the great recession of 2008. It was an inefficient stock market, not poor operating results, or even weak economies, that hurt the performance of this company.
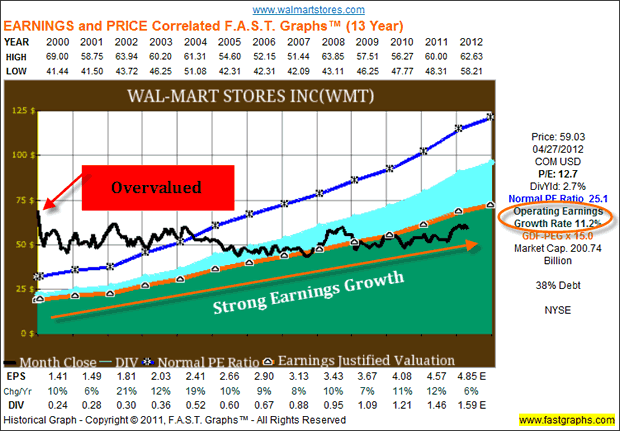
Even though Wal-Mart's earnings growth averaged better than 11% per annum since calendar year 2000, the shares were not able to overcome the headwinds of excessive overvaluation. Consequently, shareholders lost money, but not because the company was poorly managed or because the economy went through two recessions. Shareholders lost money because Mr. Market overpriced their shares in a very inefficient manner during the irrational exuberant period which ended in calendar year 2000.
Pitney Bowes Inc. (PBI)
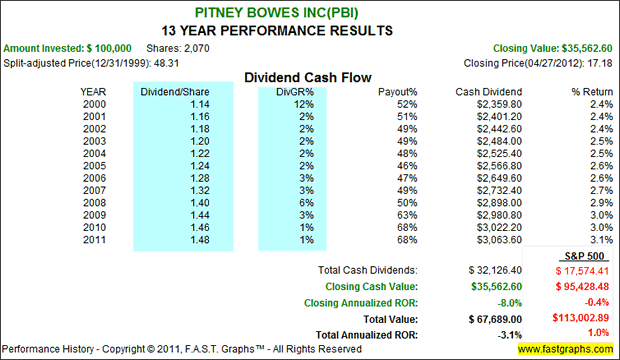
Our worst-performing Dividend Aristocrat, Pitney Bowes, is one of the few Dividend Aristocrats that actually experienced an earnings drop-off since calendar year 2000. However, all of it occurred since the great recession of 2008. Therefore, this company had two strikes going against it. Strike one, was massive overvaluation at the beginning of the timeframe, and strike two, falling earnings since the great recession.
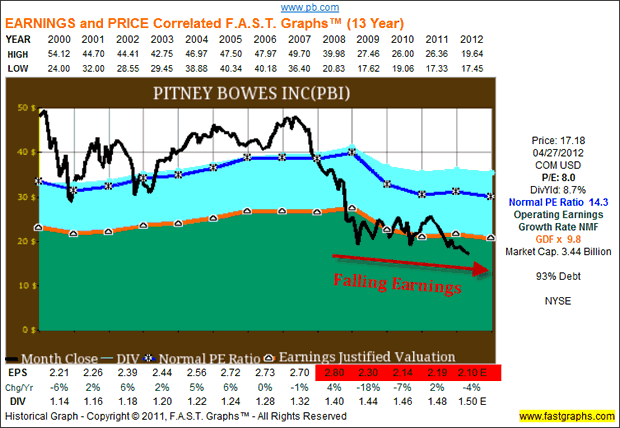
However, in spite of falling earnings, Pitney Bowes managed to raise their dividends every year since calendar year 2000. Nevertheless, shareholders lost a considerable portion of their initial investment even when dividends are added in. But most importantly, Pitney Bowes' problems were all company specific, rather than a function of a bad market.
Summary and Conclusions
There are numerous lessons that I believe can be learned by a careful analysis of the above tables and individual earnings and price correlated company specific F.A.S.T. Graphs™. First of all, it should be recognized that Dividend Aristocrats, almost by definition, are above-average quality operating enterprises. A company cannot increase its dividend every year for 25 or more years without having a good operating history that includes strong balance sheets, and healthy earnings and cash flow generation. Second, the results that these quality companies produced validate my thesis that it is more appropriate to think of a market of individual stocks in contrast to a stock market.
But perhaps one of the most important lessons of all is the validation of the benefits of taking an optimistic view of stocks. Business cycles, which include recessions and sometimes unforeseen catastrophic events such as 911 should be expected. However, we should all realize that so far none has ever been severe enough to completely destroy our economy. And, God forbid, if one ever does, there is absolutely nothing anyone could do to protect themselves anyway. As I like to say, you can't manage portfolios based on Armageddon. Therefore, I strongly believe that the optimistic approach is the superior and most profitable one to take.
Volatility can only hurt you if you react to it. And you should not react to it unless there is a real fundamental deterioration with the fundamentals of the businesses you own. If fundamentals are strong and price falls, then buy more if you can, or hold if you can't buy more. Note that as three of the four specific examples that were cited in this article illustrate, the very best companies can remain profitable even during our most severe economic challenges. Consequently, when you can find these companies on sale, regardless of what caused it, I believe you should consider optimistically investing in them. It sure beats taking losses that you don't need to absorb.
sure: Long CLX, VFC, WAG, MKC, BCR, ADP, MDT, T, XOM, MCD, KO, PG, GPC, KMB, ITW, MHP, SYY, CL, JNJ, AFL, ABT, PEP at the time of writing.
By Chuck Carnevale
Charles (Chuck) C. Carnevale is the creator of F.A.S.T. Graphs™. Chuck is also co-founder of an investment management firm. He has been working in the securities industry since 1970: he has been a partner with a private NYSE member firm, the President of a NASD firm, Vice President and Regional Marketing Director for a major AMEX listed company, and an Associate Vice President and Investment Consulting Services Coordinator for a major NYSE member firm.
Prior to forming his own investment firm, he was a partner in a 30-year-old established registered investment advisory in Tampa, Florida. Chuck holds a Bachelor of Science in Economics and Finance from the University of Tampa. Chuck is a sought-after public speaker who is very passionate about spreading the critical message of prudence in money management. Chuck is a Veteran of the Vietnam War and was awarded both the Bronze Star and the Vietnam Honor Medal.
© 2012 Copyright Charles (Chuck) C. Carnevale - All Rights Reserved Disclaimer: The above is a matter of opinion provided for general information purposes only and is not intended as investment advice. Information and analysis above are derived from sources and utilising methods believed to be reliable, but we cannot accept responsibility for any losses you may incur as a result of this analysis. Individuals should consult with their personal financial advisors.
© 2005-2022 http://www.MarketOracle.co.uk - The Market Oracle is a FREE Daily Financial Markets Analysis & Forecasting online publication.


