


U.S. Q1 2012 GDP Sends Mixed Message
Economics / US Economy Apr 28, 2012 - 11:36 AM GMTBy: Tony_Pallotta

 The US economy expanded 2.2% in Q1 2012 versus 3% in Q4 2011 based on the first of three GDP estimates. Forecasts were for 2.5% growth with "whisper" numbers in the 3% range. As always on the surface this appears OK although one can easily argue this far into a "recovery" the economy should be growing at a faster pace. In fact the economy is closer to "stall speed" versus "escape velocity."
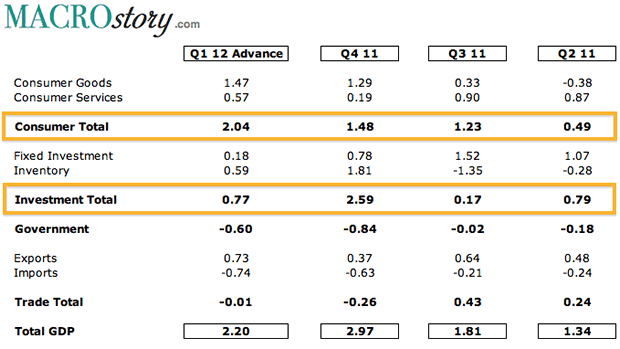
The biggest surprise was the consumer component of GDP which contributed 2.04% offsetting the government which was a net drag of (0.60%). The other surprise comes from fixed investment at 0.77% down from 2.59% in Q4 2011.
So a surprise beat from the consumer offset a surprise drop in fixed investment. Which is a little odd because fixed investment would lead the consumer. The "things" that fuel consumer consumption must be built before they can be bought right? The data would actually say the consumer just finished their last big spending spree.
Consumer
The consumer contributed 2.04% of the 2.2% total economic growth or roughly 93% versus the historical average of 70%. Purely looking at the trend below one can argue this surprise strength is really no surprise. After all the consumer has been trending higher.
The real question becomes is this sustainable. After all we know real (inflation adjusted) wage growth is flat at best. So the consumer has less money to spend on "stuff." Which explains why the savings rate is at multi-month lows. But history has shown and I have discussed to the point of redundancy that a falling savings rate is unsustainable.
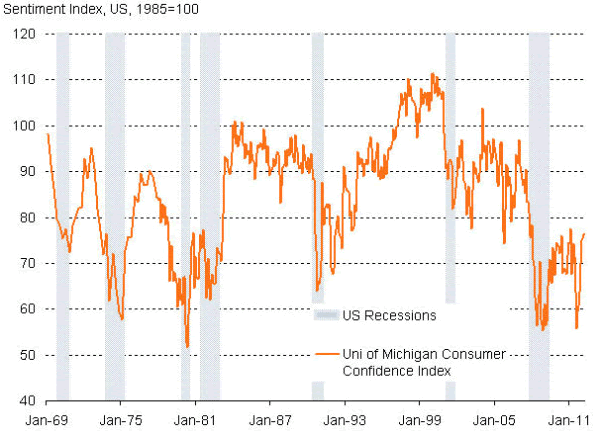
Then I came across the following chart which I found very timely and telling. Notice how consumer confidence seems to parabolically rise prior to recession. Similar to the rise right now. It's as if the consumer completely ignores the deteriorating environment and enters a euphoric stage. I mean why is the consumer so confident? Is it rising stock prices? It certainly can't be that they are saving less and certainly not because they are making less.
Inventory
Regardless of why the consumer is so happy the data below shows that this is in fact likely their last gasp. We speak through our wallets or shall I say credit cards. Confidence and spending do go hand in hand. If confidence is rising so is spending and vice versa. So the question becomes has confidence and therefore spending peaked?
Today's data would say yes. Why else would fixed investment have plunged. In fact it has been plunging so the question really becomes why did Q4 2011 fixed investment rise so much? Notice the chart below showing the quarterly change in GDP components.
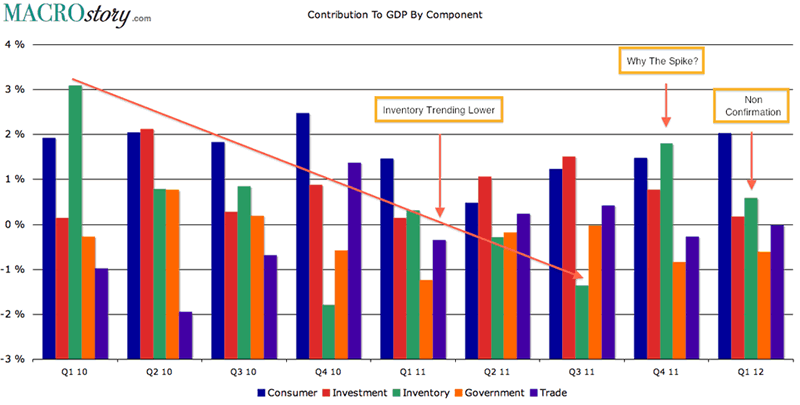
What stands out the most is inventory. Notice how inventory was trending lower as the build cycle matured. Then Q4 2011 saw a huge spike. What drove this spike? Was it confidence that demand was picking up? Clearly the retail channel did not have this confidence as they have not invested in higher inventory levels which remain below pre-recession highs unlike manufacturing and wholesale.
Perhaps it was an inflation hedge as manufacturers wanted to build future demand at lower prices as they saw input costs rising. Regardless of why the subsequent plunge in Q1 2012 inventory would say that Q4 2011 simply pulled forward economic activity setting up future weakness.
Bottom Line
Q1 2012 GDP data does not look like that of an expanding economy. It looks like an economy headed for recession. If the "stuff" needed to bought by consumers to grow the economy is not being made then how will the economy grow? Why is the "stuff" not being made? Why has fixed investment been falling? Why did inventory put in a sharp reversal?
In fact I would argue we already are in recession yet the BEA through a reduced price deflator has "inflated" growth. The latest CPI showed inflation at 2.9% on a 12 month rolling basis. So why is the price deflator only 1.5%? One could easily argue if using the proper estimate of inflation that GDP expanded 0.8% which is in fact "stall speed."
By Tony Pallotta
Bio: A Boston native, I now live in Denver, Colorado with my wife and two little girls. I trade for a living and primarily focus on options. I love selling theta and vega and taking the other side of a trade. I have a solid technical analysis background but much prefer the macro trade. Being able to combine both skills and an understanding of my "emotional capital" has helped me in my career.
© 2012 Copyright Tony Pallotta - Disclaimer: The above is a matter of opinion provided for general information purposes only and is not intended as investment advice. Information and analysis above are derived from sources and utilising methods believed to be reliable, but we cannot accept responsibility for any losses you may incur as a result of this analysis. Individuals should consult with their personal financial advisors.
© 2005-2022 http://www.MarketOracle.co.uk - The Market Oracle is a FREE Daily Financial Markets Analysis & Forecasting online publication.