


Basket of Goodies Suggest Gold is Set to Break New Highs
Commodities / Gold and Silver 2012 Apr 27, 2012 - 01:53 PM GMTBy: David_Petch

 Over the past weekend, China announced that they would purchase Iranian oil through sale of gold beyond June 28 2012 in order to get around US sanctions that states no nation can sell oil in US Dollars This has profound implications going forward, as this will be the first time in nearly 70 years that the US Dollar as a reserve currency has been challenged. The article I penned back in 2003 titled "Whose Gonna Say Uncle" mentioned that block currencies will likely form due to localization of economies due to energy constrictions etc. The BRICS nations have primarily been the target of sabre rattling through the US government, so actions taken by China is likely to be conducted on a massive scale going forward as other nations seek better control over their own destiny.
The BRICS nations are a force to be reckoned, with, from a financial and military perspective. Sabre rattling coming out of Washington is merely that...there is not much that they can do to save the US Dollar, as other nation blocks slowly attempt to create localized currencies. All major wars being fought at present are economically related as each country tries to stay afloat in an environment where an ever increasing amount of debt is created daily to prevent deflation (Note: This can only be put off for so long as the CFS cycle reaches its next downward turning point).
As bickering and economic warfare continue up front along with the Bread and Circuses put on national TV to dumb down the masses, the page 16 story (As Donald Coxe refers to stories out of the eyes of the majority) unfolding is that gold is slowly being set up to be a major currency of exchange. Banks around the globe are quietly accumulating metal in order to preserve wealth for what lies ahead beyond 2020. Between now and 2020, gold is likely going to see a spike high between $7000-10,000/ounce (maybe higher) and then drop by 50% and baseline.
Subsequently, a broad stock market rally beyond 2020 will be likely likely after ending a near 20 year bear market. During this time, governments will still have to inflate, but this will be the start of an inflationary cycle, which should see the DOW reach 200,000ish at some point this century, as per Glenn Neely's long-term forecast. As assets rise in price, it will still be important to have gold-backed currencies, as people 8 years out will not want a repeat of 2000-2020.
Back here in good ol' 2012, we still have 8 years of tough sledding before we get through this mess and the only thing I have seen to somewhat guide with reasonable accuracy for turning points is the Contracting Fibonacci Spiral first observed last July. The target date for the broad markets putting in a high is between September 12, 2012 and March 6th, 2013, with December 6th 2012 as the ideal mid point. During other cycles, the S&P has remained buoyant after putting in a high while other sectors of the economy rally.
The CFS date for gold I believe is September 13th, 2013, which could occur as early as May 2013. Given the expected decline in the US Dollar Index starting anytime between mid May to early June, this suggests that a 10-12 month rally in precious metal stocks and commodities is likely. At present, there is no shortage of liquidity and we are nearing the stage where funds are rotating into under performing sectors.
Within the CFS, declines are noted by sharp periods of deflation, such as that witnessed in 2008. The next round of deflation is starting to appear as is if it will occur between May 2013 and August 2013 and last until late 2014. As we reach the point of singularity in 2020, market volatility is going to be at levels never seen before.
The one sector witnessing a large counter trend relative to the broad stock market indices is the precious metal arena AKA the AMEX Gold BUGS Index. This has been the one sticking point with the CFS which is seeing gold stocks marching to the beat of its own drummer at present. As mentioned current lows in the HUI will represent a generational low relative to the price of gold. On Friday, the HUI/Gold ratio gapped down to 0.26 and has two daily hammer doji's in place. It is important to note that the 2008 lows saw a spike low value of 0.20, which was a spike low. Values quickly bounced up to 0.25 and trended to near 0.45 before declining. At present, we have gold above $1600/ounce, while gold stocks are priced as if gold was $700/ounce.
With gold set to move higher with continued money printing campaigns, it only makes sense that gold stocks rise accordingly. By Christmas time, everyone in PM's should have something to smile about, with the top expected sometime between April and June 2013 in the HUI. The above information is how things are thought should logically progress before we hit the next wave of deflation (It will be far more severe than 2008). As mentioned before, avoid adding further positions to PM stocks until we have a clear indication that a bottom has been put in place.
Accompanying this text are related charts of 3 currencies, the US Dollar Index and one chart of Gold illustrating that a breakout to the upside is looming.
Currencies
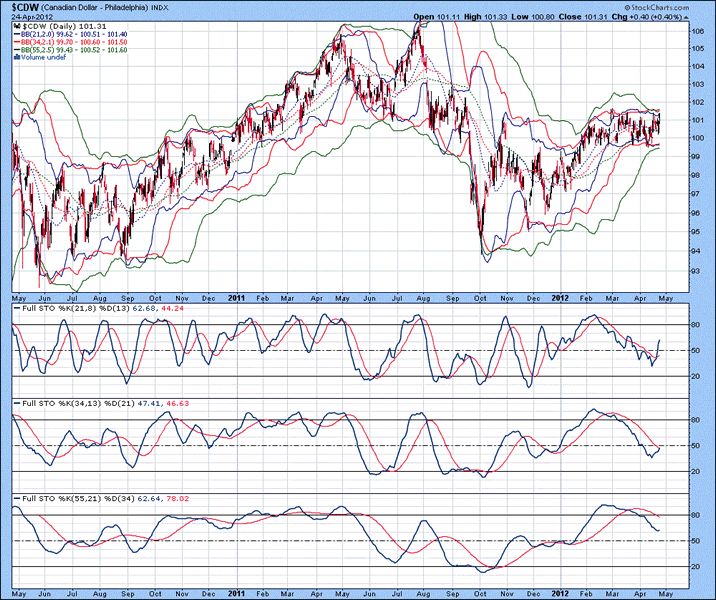
The daily chart of the Canadian Dollar Index is shown below, with a closing value of $101.31, just at the upper point of resistance. All three lower Bollinger bands are in close proximity to each other, and if they begin to curl down, it will indicate the Loonie is set to climb higher. An inverse head and shoulders pattern appears to have been put in place, which has a measured move of 12 cents, or $1.13 relative to the US Dollar Index. Our target for the Loonie in 2012/early 2013 remains $1.13-1.15, while a spike high to $1.18-1.20 remains within the realms of probability. Full stochastics 1, 2 and 3 are shown below in order of descent, with the %K above the %D in 1 and 2 and beneath the %D in 3. Positioning of the %K in stochastic 2 clearly indicates that an upward bias exists. As mentioned last week, the Canadian and Australian dollars are both resource or "Colonial Currencies" as higher commodity prices drive their pricing power. Colonial currencies set to break out strongly suggest a run up in commodity prices, which in turn would see an associated decline in the US Dollar Index.
Figure 1
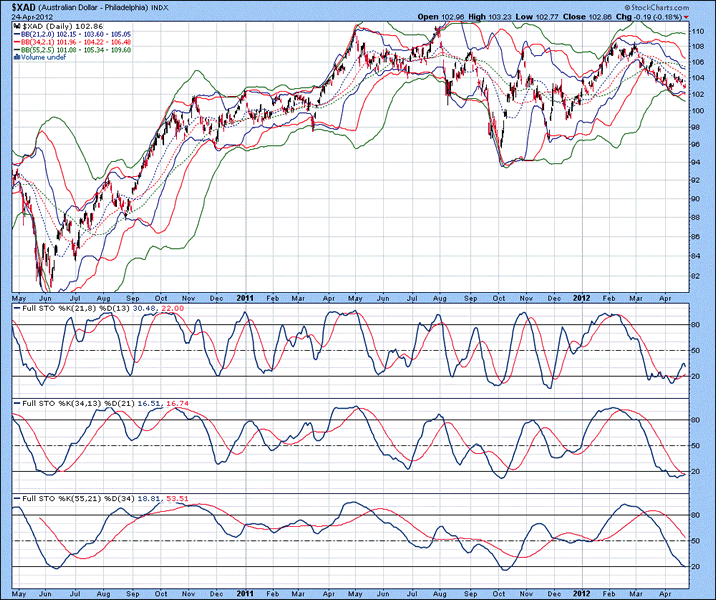
The daily chart of the Australian Dollar Index is shown below, with lower 21 and 34 MA Bollinger bands in close proximity to each other beneath the index. Full stochastics 1, 2 and 3 are shown below in order of descent, with the %K above the %D in 1 and beneath the %D in 2 and 3. The Loonie had a sideways consolidation, while the Currency from Down Under had an approximate 45o decline. An inverse head and shoulders pattern is also visible for the Australian Dollar, with a measured move to approximately $1.16...the target remains $1.16-1.18, with the potential to see $1.22-1.24 in an extreme overshoot. So, the way to trade this if everything goes to plan is to sell precious metal stocks near the highs around this time next year (maybe earlier) and rotate funds into US Dollars as deflation will see this rise in value. Timing will be very important, so the Captain and I will be working on trying to come up with a tighter CFS model for when to bail from the PM's. We are nearing a PM bottom, so there is no cause for concern about exiting for some time. Again, continue to avoid adding further PM positions (unless one has disposable income and does not require the money for at least 10-12 months) until a top in the US Dollar Index has definitively been put in place.
Figure 2
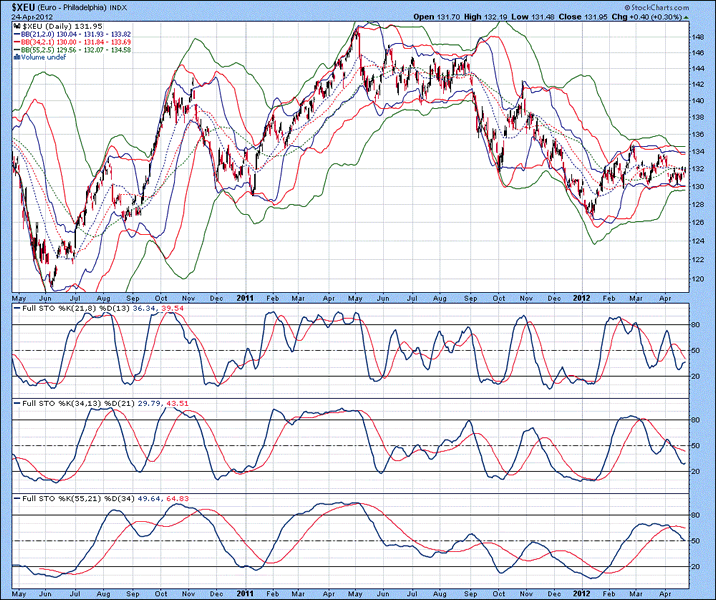
The daily chart of the Euro Index is shown below, with upper and lower Bollinger bands continuing to envelope the sideways price action. Full stochastics 1, 2 and 3 are shown below in order of descent, with the %K beneath the %D in all three instances. There is no sign of a bottom in the Euro at present, but is expected to be put in place sometime between mid to late May 2012. The Euro is expected to at least retest the 148 level relative to the US Dollar...in the past, other currencies were weaker than the USD at the former Euro high, but stronger currencies against the US Dollar Index will drive its value down to the 64-66 level (56-58 for a spike low).
Figure 3
US Dollar Index
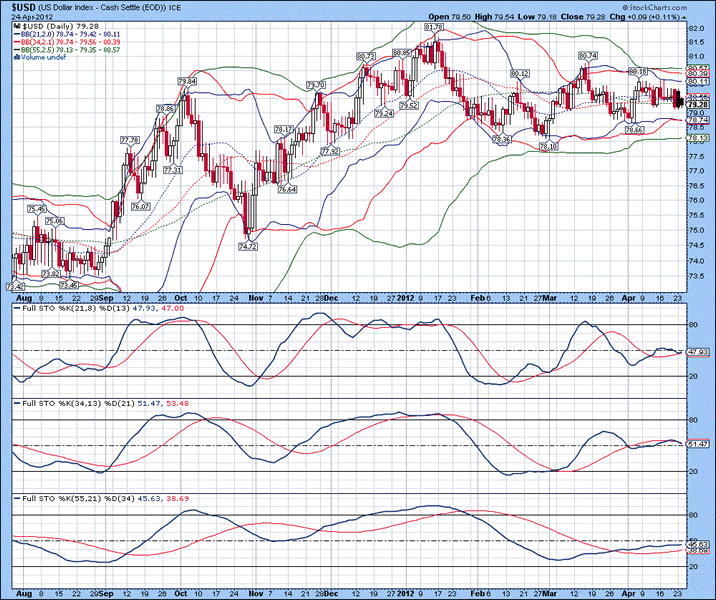
The daily chart of the US Dollar Index is shown below, with upper and lower Bollinger bands continuing to envelope the sideways price action. Full stochastics 1, 2 and 3 are shown below in order of descent, with the %K above the %D in 1 and 3 and beneath the %D in 2. There is no clear indication on the daily chart as to whether or not a breakout to the upside or downside will occur...just sideways price action.
Figure 4
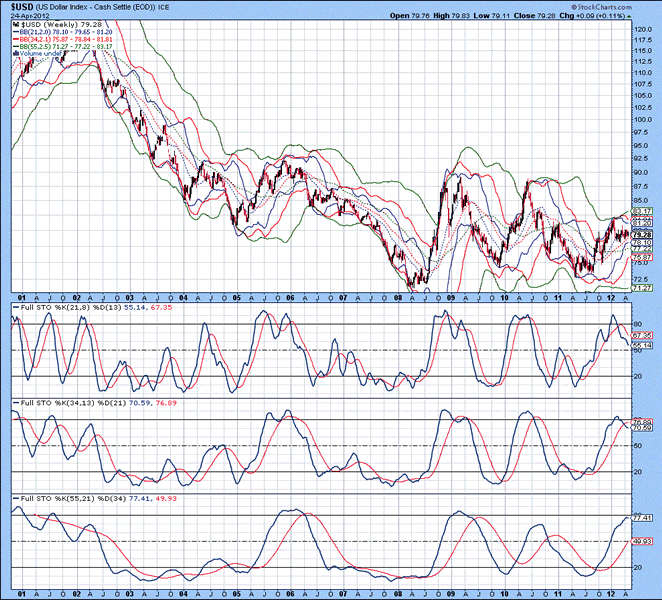
The weekly chart of the US Dollar Index is shown below, with lower 21 and 34 MA Bollinger bands rising towards the current price, while the lower 55 MA Bollinger band continues to go sideways. Full stochastics 1, 2 and 3 are shown below in order of descent, with the %K beneath the %D in 1 and 2 and above the %D in 3. Full stochastics having the %K in 1and 2 fall beneath the %D, while remaining lofty in stochastic 3 indicates that a top is looming. Although there is no indication of a top on the weekly chart, weakness is indicated.
Figure 5
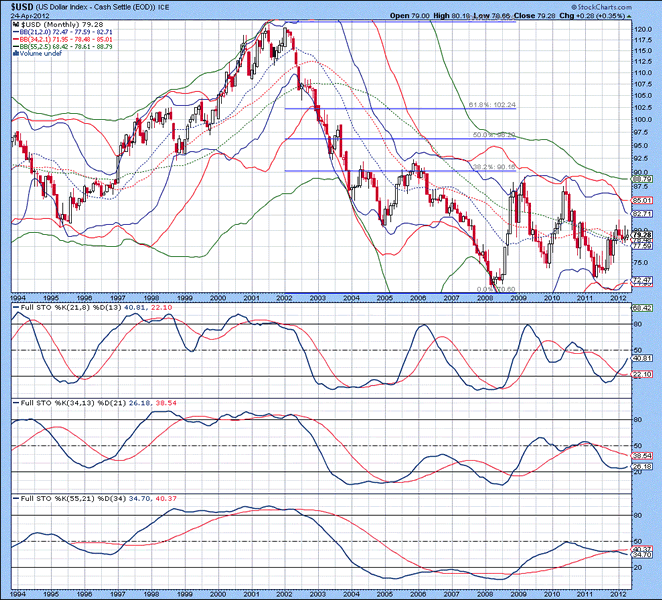
The monthly chart of the US Dollar Index is shown below, with two monthly shooting star doji's put in place. Lower 21 and 34 MA Bollinger bands are in close proximity to each other, while upper Bollinger bands are starting to decline towards the current price. Full stochastics 1, 2 and 3 are shown below in order of descent, with the %K above the %D in 1 and beneath the %D in 2 and 3. As mentioned earlier, we are either at the cusp of a 1996 equivalent breakout or a late 2006 decline...all of the technical information examined collectively suggests that a decline in the US Dollar Index is likely before it rises during deflation expected to occur between mid 2013 and late 2014.
Figure 6
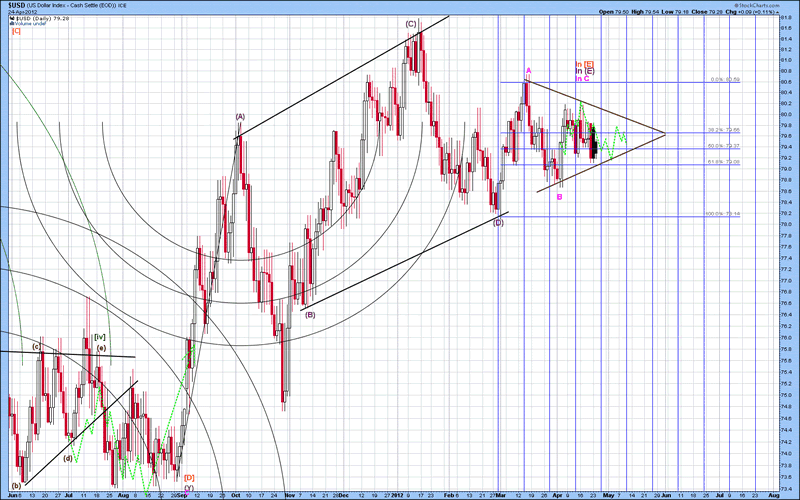
The short-term Elliott Wave count of the US Dollar Index is shown below, with the thought pattern forming denoted in green. There is a strong probability that wave D is underway, with wave E remaining before the entire corrective pattern since early September 2011 started. Subsequently, a sharp downward move is expected.
Figure 7
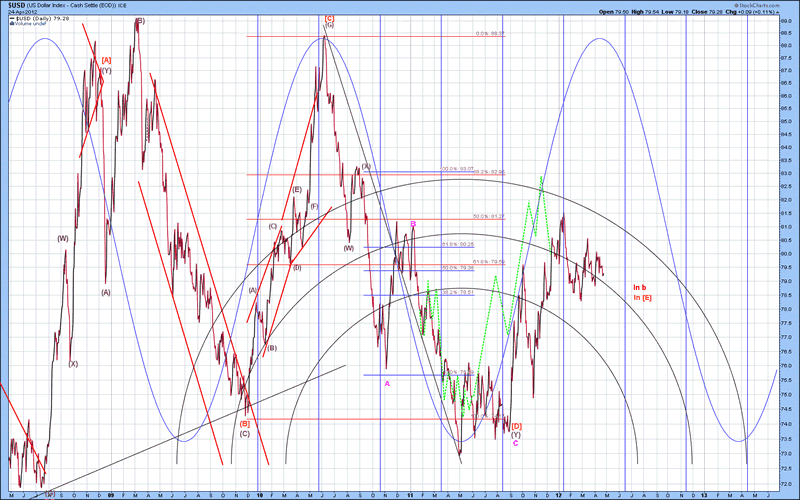
The mid-term Elliott Wave count of the US Dollar Index is shown below, with the thought pattern forming denoted in green...the pattern took 4 months longer to complete last summer than anticipated, so mentally shift the image to the right and it fits rather well. The entire pattern below represents a large triangular pattern forming since 2008, with wave [E] nearing completion. Once wave [E] is complete, then 73.7 must be taken out in an equivalent or shorter period of time than wave [E] took to form (9 months). Also, the price must decline below 71.0 within 4 years or less...chances are that we take out 73.7 before October and 71.0 before year end. The measured move down from the large triangle is the longest wave price action subtracted from the terminal price of the pattern...79-14.5 equals 64.5, which falls within our downside target of 64-66. In the event of a spike low, the US Dollar Index could see 56-58 reached. When the lows are established in 2013 (Likely between April and August 2013), a very sharp move to the upside is due. The safest and best way to profit from this move is to exit stocks and go long the US Dollar. At least a 15-20 point move is expected, which represents a very good return during a period of deflation. Exiting the US Dollar Index near the end of 2014 will be very important, as commodity prices are likely to soar much higher.
Figure 8
Gold
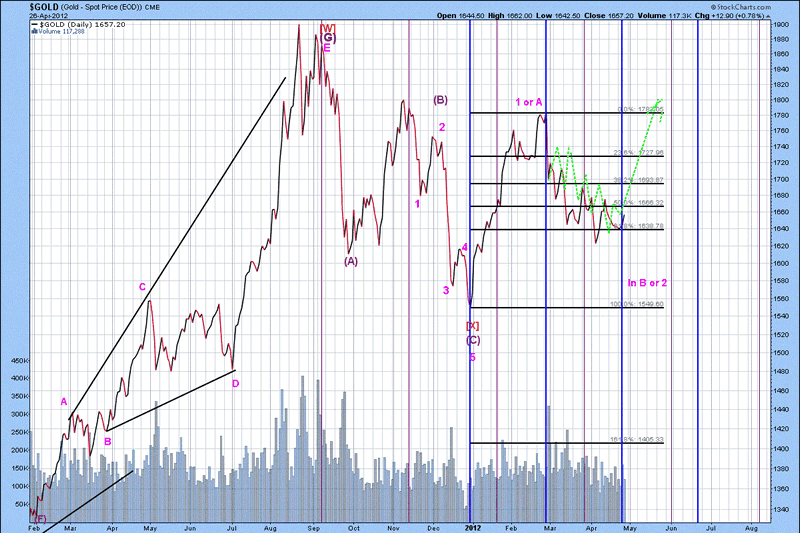
The short-term Elliott Wave count for gold is shown below, with the thought Elliott Wave count forming denoted in green. Wave 1 or A was thought ot have completed in late February, wave wave 2 or B forming at present. Since the 61.8% retracement level has held so far, it is reasonable to assume that the wave structure presented is accurate. If so, then the next leg up should reach anywhere from $1870 - $1985/ounce within a 2-3 month time frame. If the wave count of the US Dollar is correct, then a 10-12 month window of upside in precious metals and related shares lies just ahead. This is something that we will be tracking very closely.
Figure 9
Have a great day.
By David Petch
http://www.treasurechests.info
I generally try to write at least one editorial per week, although typically not as long as this one. At www.treasurechests.info , once per week (with updates if required), I track the Amex Gold BUGS Index, AMEX Oil Index, US Dollar Index, 10 Year US Treasury Index and the S&P 500 Index using various forms of technical analysis, including Elliott Wave. Captain Hook the site proprietor writes 2-3 articles per week on the “big picture” by tying in recent market action with numerous index ratios, money supply, COT positions etc. We also cover some 60 plus stocks in the precious metals, energy and base metals categories (with a focus on stocks around our provinces).
With the above being just one example of how we go about identifying value for investors, if this is the kind of analysis you are looking for we invite you to visit our site and discover more about how our service can further aid in achieving your financial goals. In this regard, whether it's top down macro-analysis designed to assist in opinion shaping and investment policy, or analysis on specific opportunities in the precious metals and energy sectors believed to possess exceptional value, like mindedly at Treasure Chests we in turn strive to provide the best value possible. So again, pay us a visit and discover why a small investment on your part could pay you handsome rewards in the not too distant future.
And of course if you have any questions, comments, or criticisms regarding the above, please feel free to drop us a line . We very much enjoy hearing from you on these items.
Disclaimer: The above is a matter of opinion and is not intended as investment advice. Information and analysis above are derived from sources and utilizing methods believed reliable, but we cannot accept responsibility for any trading losses you may incur as a result of this analysis. Comments within the text should not be construed as specific recommendations to buy or sell securities. Individuals should consult with their broker and personal financial advisors before engaging in any trading activities as we are not registered brokers or advisors. Certain statements included herein may constitute "forward-looking statements" with the meaning of certain securities legislative measures. Such forward-looking statements involve known and unknown risks, uncertainties and other factors that may cause the actual results, performance or achievements of the above mentioned companies, and / or industry results, to be materially different from any future results, performance or achievements expressed or implied by such forward-looking statements. Do your own due diligence.
Copyright © 2012 treasurechests.info Inc. All rights reserved.
Unless otherwise indicated, all materials on these pages are copyrighted by treasurechests.info Inc. No part of these pages, either text or image may be used for any purpose other than personal use. Therefore, reproduction, modification, storage in a retrieval system or retransmission, in any form or by any means, electronic, mechanical or otherwise, for reasons other than personal use, is strictly prohibited without prior written permission.
David Petch Archive |
© 2005-2022 http://www.MarketOracle.co.uk - The Market Oracle is a FREE Daily Financial Markets Analysis & Forecasting online publication.