


.
Commodities / Gold & Silver Jan 20, 2007 - 08:19 PM GMTBy: Joe_Nicholson
 Even after last week's rally, there is still talk about the run in commodities being finished. If you watched CNBC, you heard over and over that money had rotated out of commodities and into tech and, later, into retail. But, as we proudly boasted last week, even in the midst of this so-called "collapse", gold and silver never broke their psychological $600 and $12 support levels. And the action since last weekend's update fit the proscription very closely.
We said: The daily charts below reveal that GLD is now very close to resistance at its 50-day moving average. A convincing move to $63 in the ETF would echo the signal that the spot market has cleared a path to $640 gold, but it will take more than technical impetus alone.
Gold and silver indeed got a lift off of Tuesday's PPI data, but with oil still heading lower, inflation concerns ebbed rather quickly and the dollar rallied back from early losses. GLD turned negative before spot gold could, as if traders were telling the physical market they were disinterested in the inflation number, and the spot price soon followed.
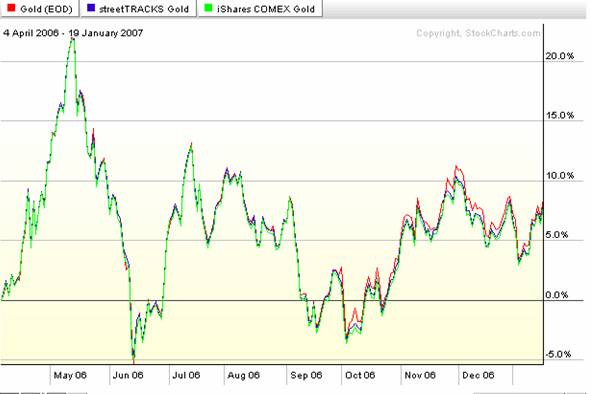
As was posted in the forums, the action on Tuesday illustrates exactly why the metals ETFs can be useful to gauge the speculative trading interest in gold and silver. The chart below shows that, while in the past GLD and IAU have made identical moves to gold futures, the ETFs are now less eager to follow the physical metal to its highs, and often extend its lows. Fast-moving fund managers are much more likely to buy the ETFs than venture into the futures markets, and their moves are the very stuff that fuels intraday volatility and ultimately produces parabolic spikes or breakdowns. The reduced confidence in the metals complex, as shown by the divergence on the left side of the chart, is at least partly attributable to the beating that the metals have taken in mainstream media.
The reaction to the CPI release was largely the same as Tuesday, though a bit more pronounced, with metals essentially bouncing off the resistance levels outlined last week and finding support without dramatic losses. GLD reached the heralded $63 mark briefly, only to reverse and arc back down. The rally on Friday, off a weak dollar, put the ETF right back at $63 and leaves us in roughly the same position as we ended last week, though, perhaps, a bit stronger technically. So, remember, we said a week ago:
In the short term, if next week's data continue to nourish the sentiment that the economy has rounded the bottom, a veritable soft landing, then metals have a realistic shot at overtaking resistance. The hotter the economy appears to become, the more willingness investors should have to get back into mining stocks and the greater the inflation concerns will become.
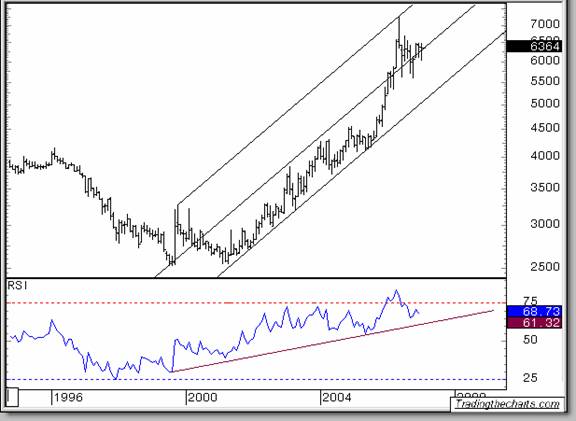
The same holds true for this week, and housing data in particular will likely continue to color perceptions of the economy's overall health. Technically, gold is poised to challenge $640 if the economic factors are right, and silver can take $13 and more if the environment is conducive to buying. The next chart shows gold poised to choose between the upper and lower channels of its multi-year uptrend. Remember, our most conservative estimate has the metal rejoining the lower trendline and, with an RSI in the upper 60's, any rally from here could soon see gold having fits and starts from bouts of profit-taking.
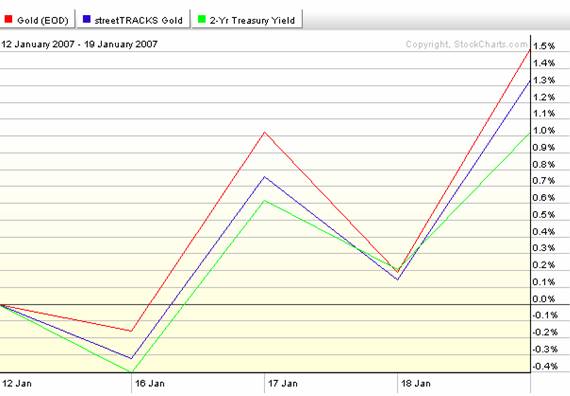
As we look ahead, it's also important to remember there are always many factors affecting the dollar value of precious metals, and that they don't always act equally. In other words, sometimes gold trades with stocks, sometimes against them. Sometimes it moves opposite the dollar, but sometimes it can go with the dollar if a growing economy is causing higher inflation and demand for hard commodities. The latter has been the case recently and, as the chart below shows, gold has moved over the past week in lockstep with short term bond yields. This is not enough evidence to say that money is moving directly between treasuries and precious metals, but, over the past five days, gold has risen concurrently with buyers abandoning the 2-year note and dropped as they rushed back in.
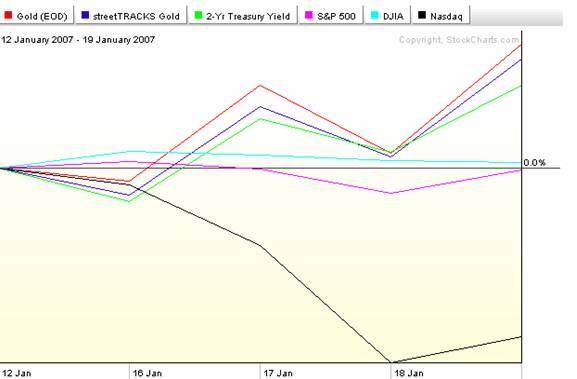
The next chart juxtaposes the major averages to show gold's outperformance as further evidence that the demise of precious metals is well overstated, and at least a suggestion of where bond market dollars may have been moving.
This update continues to be spot on about Fed expectations, after having boldly announced months ago that rate cut expectations were unjustified. This past week finally saw the fed funds futures price odds of a rate hike, even if it was a modest 2%. Unless there is calamity in the mortgage industry or some other exogenous terrorist or geopolitical event, it continues to appear the economy will grow and produce inflation until the Fed is ultimately forced to raise rates and soak up excess liquidity. Refer to last October's update titled “Gold and Goldilocks” for an examination of the metals complex's potential in an environment of rising interest rates.
Our opinions are on the record, but we should reiterate our caveats, nonetheless, that contained inflation expectations and a relatively buoyant dollar are exactly the preconditions the Fed would need to suddenly cut should a significant economic emergency begin to emerge from behind the curtain of easy credit and questionable economic data. And, along those lines, metals traders should be wary of contractions in the monetary base, the behind-the-scenes open market activities of which we've steadily cautioned, which could already be underway even now to offset the dramatic swelling in the fourth quarter of 2006 that appeared concurrent with a rally in both metals and equities.
Finally, thanks go out to everyone who's recently participated in the metals forum and shared their charts and thoughtful insight. Keep up the good work! And, if you're not part of the discussion yet, maybe you should be!
by Joe Nicholson (oroborean)
This update is provided as general information and is not an investment recommendation. TTC accepts no liability whatsoever for any losses resulting from action taken based on the contents of its charts,, commentaries, or price data. Securities and commodities markets involve inherent risk and not all positions are suitable for each individual. Check with your licensed financial advisor or broker prior to taking any action.
Joe Nicholson Archive |
© 2005-2022 http://www.MarketOracle.co.uk - The Market Oracle is a FREE Daily Financial Markets Analysis & Forecasting online publication.