Final High 2012 For Stock Market and Economy
Stock-Markets / Financial Markets 2012 Apr 27, 2012 - 02:27 AM GMTBy: Clif_Droke
 It's amazing sometimes how much difference a year can make on investor psychology. For most of last year investors worried incessantly about a potential "double dip" U.S. recession and the possibility of another worldwide credit crisis beginning in Europe.
Fast forward to 2012 and those worries have mostly evaporated from investors' minds. The consensus now is that the economy has improved and corporate earnings will continue to increase. The biggest worry for most investors is where they can achieve the biggest dividend yield while the Fed continues to artificially hold down bank interest rates. They further believe that the bull market that began in March 2009 will continue to achieve higher stock prices into 2013.
One analyst who doesn't share this consensus view is Samuel "Bud" Kress of the SineScope advisory [15 Phoenix Ave., Morristown, NJ 07960]. Mr. Kress, whose namesake Kress cycles have presciently forecast many of the important turning points in the market over the years, recently published his annual Special Edition forecast for the years 2012-2014. Entitled "Special Edition XII: A Comprehensive Perspective," the report provides insights on what investors can expect heading into the final, fateful years of the 120-year cycle.
In his previous Special Edition XI, Kress discussed the likelihood based on the yearly cycles that a major stock market high will occur in 2012. The assumption is that in 2013 a severe, potentially historic decline will begin to last until later 2014 when the Grand Super Cycle of 120 years bottoms.
The numeric time cycles which comprise the 120-year series include the 60-year, the 40-year, the 24-year, the 20-year and the 12-year. The 120-year is the primary composite cycle according to Kress. It includes three 40-year primary bias cycles and five 24-year primary direction cycles. The 60-year secondary composite cycle (which is analogous to the "K Wave") includes three 20-year secondary bias and five 12-year secondary direction cycles. As Kress points out in his latest report, "Excluding both composite cycles, this leaves four cycles which determine the market directional behavior for the three designations of time - years, quarters and weeks." In total, there are twelve cycles comprising the Kress cycle methodology.
The 120-year primary composite cycle is the Grand Super Cycle. Kress points out that the first 120-year cycle began in the mid 1770s following prolonged depressed conditions and the Revolutionary War which transformed American from an occupied territory to an independent country of the United States which we know today. The 120-year cycle is also known as the Revolutionary Cycle since its bottom is always accompanied by a major revolution. The first 120-year cycle in the 1770s created a political revolution.
The next 120-year cycle bottomed in the mid 1890s after the first major economic depression in the U.S. Following the 120-year cycle bottom of the 1890s the U.S. transformed from an agricultural to a manufacturing based economy, hence the U.S. Industrial Revolution was born. The latest 120-year cycle bottom is scheduled for later 2014, which in the words of Kress, will complete the "institutional triad [and will be] a social revolutionary low." According to Kress, a major war cannot be ruled out following the bottom of the 120-year cycle in 2014, just as the previous 120-year cycle bottom in the 1890s was followed by the Spanish American War. Ominously, he believes that the 2014 cycle bottom holds the potential for a third major depression and the completion of the trend toward socialist government in the U.S., possibly leaning towards totalitarianism.
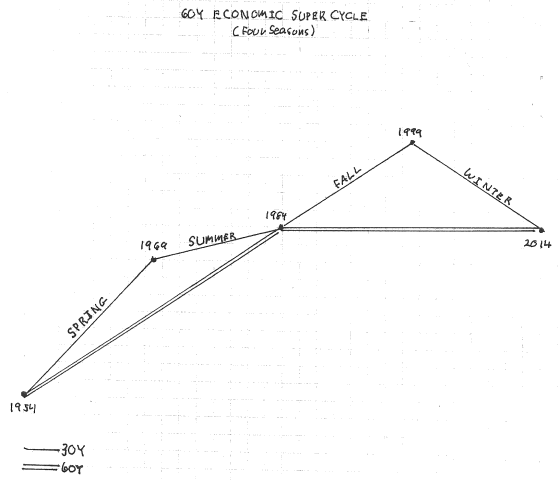
No discussion of the 120-year cycle would be complete without reference to its half-cycle component, the 60-year cycle. This cycle is most famously known to long-term investors as the "K Wave," or Kondratieff Wave, and correlates to the underlying economic super cycle in the U.S. Accordingly, Kress refers to this as the Economic Cycle. "The time position of the 60-year cycle identifies where we are in the overall economic scheme of things," writes Kress. "This second 60-year cycle of [the current] 120-year cycle peaked in 1984. The third and final 20-year secondary bias cycle [component] peaked in 2004, and the fifth and final 12-year secondary direction cycle peaked in 2008 at the time of the 'credit crash' at a high in the S&P 500 of 1,425. At that time, all the yearly cycles were in their declining phase, thereby relying on the quarterly cycles to achieve higher highs."

Kress points out that just as a year has four seasons - spring, summer, fall and winter - the 60-year cycle has four economic seasons, each one lasting 15 years. The fourth 15-year "season" began in 1999 and coincided with the beginning of economic winter. This "winter" season - the effects of which are obvious - will end in late 2014.
Unlike past Special Editions, Kress discusses the little known quarterly cycles in Special Edition XII. He reveals, for example, that the fourth and final 120-quarter/30-year primary composite cycle which began in 1984 and peaked in 1999 formed the historic "terminal high" in the S&P at 1,535 and began the economic winter season previously discussed. "The secondary 60-quarter/15-year cycle peaked in 2007 at an effective double top terminal high in the S&P at 1,570 to begin the severity of economic winter."
He added that the third and final 40-quarter/10-year primary bias cycle peaked in 2009, and the fifth and final primary 24-quarter/6-year cycle peaked in 2011, leaving only the two secondary quarterly cycles in the advancing phase. The fifth and final 20-quarter/5-year cycle peaked around late March this year, says Kress, leaving the fifth and final 12-quarter/3-year cycle of all the combined twelve yearly and quarterly cycles in its advancing phase until its scheduled peak one year from the present in March 2013. He writes, "No doubt its upside effect will be limited, and its price peak should be well before its time peak and its price peak below current levels."
Kress believes that the interaction between the briefest of the yearly cycles, the 12-year, and the composite 120-quarter/30-year cycle affords a macro perspective. According to Kress, this can be accomplished by comparing the market's current level with the levels at the peak of the current 120-quarter/30-year cycle and comparing this relationship for each of the previous three 30-year levels of the 120-year cycle. He writes, "For each of the three previous 30-year periods, the market was higher thirteen years later. However, for the current period, the market is lower. Clearly, economic winter is causing the Industrial Revolution to falter."
Concluding his Special Edition, Kress observes: "The culture and the mindset of the federal government is that it can control economics and create value. Who do you believe will prevail - 'big brother' or 'mother nature and father time'?"
Gold & Silver ETFs
While silver continues to languish, gold is finally showing signs of life. The yellow metal closed above its dominant immediate-term 15-day trend line on Thursday, April 26, and a follow-up higher close from here would technically confirm an immediate-term bottom per the rules of our trading discipline.
In an earlier commentary we examined the lack of "story" behind the metals; if gold ends up confirming a bottom in the coming days it may simply be a result of being technical buying coming out of an oversold condition. Or perhaps the recent immediate-term breakout in the China ETF (see previous commentaries) is leading the way as it has in the past. Regardless of the reason(s) for it, a 2-day higher close above the 15-day MA in the gold ETF will be a welcome event for sidelined traders.
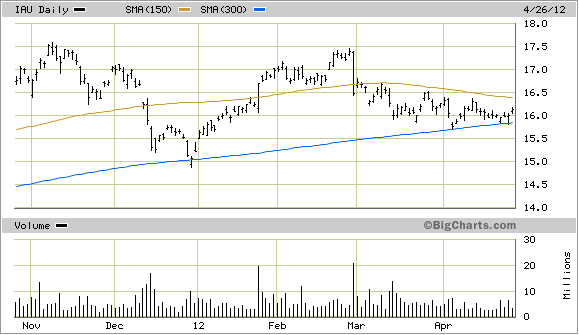
In the following chart of the iShares Gold Trust (IAU), our favorite gold proxy, note that the significant 60-week (300-day) moving average continues to act as underlying support. Meanwhile, a breakout above the 30-week (150-day) MA would be a feather in the cap of the bulls as they've been unable to overcome this technical benchmark since the IAU fell below it in late February.

Gold & Gold Stock Trading Simplified
With the long-term bull market in gold and mining stocks in full swing, there exist several fantastic opportunities for capturing profits and maximizing gains in the precious metals arena. Yet a common complaint is that small-to-medium sized traders have a hard time knowing when to buy and when to take profits. It doesn't matter when so many pundits dispense conflicting advice in the financial media. This amounts to "analysis into paralysis" and results in the typical investor being unable to "pull the trigger" on a trade when the right time comes to buy.
Not surprisingly, many traders and investors are looking for a reliable and easy-to-follow system for participating in the precious metals bull market. They want a system that allows them to enter without guesswork and one that gets them out at the appropriate time and without any undue risks. They also want a system that automatically takes profits at precise points along the way while adjusting the stop loss continuously so as to lock in gains and minimize potential losses from whipsaws.
In my latest book, "Gold & Gold Stock Trading Simplified," I remove the mystique behind gold and gold stock trading and reveal a completely simple and reliable system that allows the small-to-mid-size trader to profit from both up and down moves in the mining stock market. It's the same system that I use each day in the Gold & Silver Stock Report - the same system which has consistently generated profits for my subscribers and has kept them on the correct side of the gold and mining stock market for years. You won't find a more straight forward and easy-to-follow system that actually works than the one explained in "Gold & Gold Stock Trading Simplified."
The technical trading system revealed in "Gold & Gold Stock Trading Simplified" by itself is worth its weight in gold. Additionally, the book reveals several useful indicators that will increase your chances of scoring big profits in the mining stock sector. You'll learn when to use reliable leading indicators for predicting when the mining stocks are about o break out. After all, nothing beats being on the right side of a market move before the move gets underway.
The methods revealed in "Gold & Gold Stock Trading Simplified" are the product of several year's worth of writing, research and real time market trading/testing. It also contains the benefit of my 14 years worth of experience as a professional in the precious metals and PM mining share sector. The trading techniques discussed in the book have been carefully calibrated to match today's fast moving and volatile market environment. You won't find a more timely and useful book than this for capturing profits in today's gold and gold stock market.
The book is now available for sale at: http://www.clifdroke.com/books/trading_simplified.html
Order today to receive your autographed copy and a FREE 1-month trial subscription to the Gold & Silver Stock Report newsletter. Published twice each week, the newsletter uses the method described in this book for making profitable trades among the actively traded gold mining shares.
By Clif Drokewww.clifdroke.com
Clif Droke is the editor of the daily Gold & Silver Stock Report. Published daily since 2002, the report provides forecasts and analysis of the leading gold, silver, uranium and energy stocks from a short-term technical standpoint. He is also the author of numerous books, including 'How to Read Chart Patterns for Greater Profits.' For more information visit www.clifdroke.com
© 2005-2022 http://www.MarketOracle.co.uk - The Market Oracle is a FREE Daily Financial Markets Analysis & Forecasting online publication.


