


Deflation Possible, This isn’t 2008!
Commodities / Deflation Apr 25, 2012 - 10:53 AM GMTBy: UnpuncturedCycle

 There has been so much talk lately about the coming high inflation due to excessive printing of fiat currency, that I think it’s necessary to explore the topic. There is no doubt that the US, Europe, Japan and now China are all creating fiat currency at a rate never before in modern history. We also have had the lessons of excessive printing during Germany’s Weimar Republic drilled into our heads since the crib. Therefore we naturally assume that excessive printing in today’s world will produce the same result. When it comes to the US it is worth remembering that there are significant differences. In the first place the US dollar has been the world’s reserve currency for seven decades, and in the second place the excessive printing is nothing new in the United States.
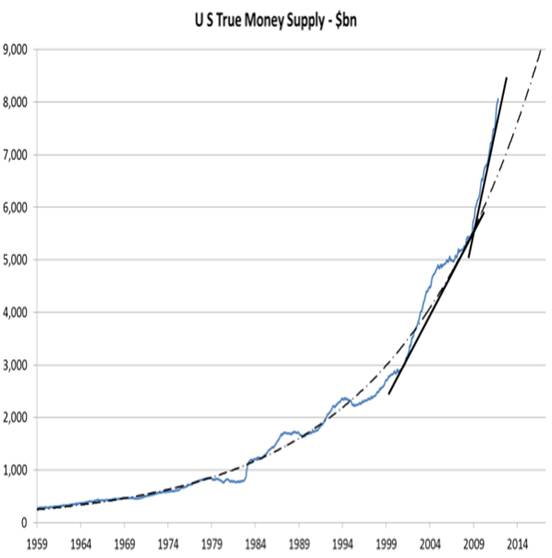
As you can see in the previous chart, the Fed has expanded the money supply ten fold over the last three decades! This increase gained speed around 1998 as the stock market topped and the Fed created the housing/credit bubble as a replacement. Money supply began to really spike after 2000 and that led to some serious increases in the prices of commodities. Take a look at this chart of the CRB Index that goes back to 2002:
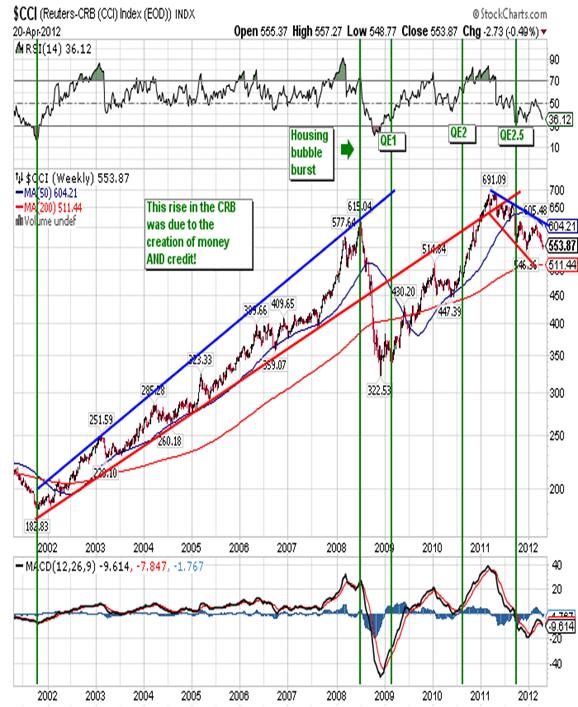
Here you can see close to a 300% increase in prices over a period that ran from 2002 to early 2008. In 2007 alone you can see an 80% increase in prices do to a combination of excessive printing and easy credit. That combination came as a result of the stock market top in 1999 and produced the housing bubble that went bust in late 2007. In short the US did experience a period of hyperinflation from early 2005 to late 2007, but since it never made the newspapers you missed it. Instead we chose to believe the numbers reported to us by the government claiming 3% inflation a year. Any person with an average IQ and a checkbook could have told you that prices were skyrocketing during that period.
When the housing bubble burst in late 2007, and stocks, commodities, and credit fell like a rock in 2008, the Fed came up with a plan to save the economy using what became known as quantitative easing. In simple terms it was a way to inject trillions of dollars into our bankrupt financial system. QE1 was announced in March 2009 and the effect was to push stocks, bonds and commodities higher, and with respect to the CRB Index, it recovered slightly more than half the decline before stalling out. More importantly, so did the Dow. Enter QE2 in August 2010 and the CRB Index moved to a higher high, but the Dow didn’t. Never fear! The Fed decided that a tweak was in order so they proposed Operation Twist (QE 2.5) in July 2011 and this was followed by a US $1 trillion QE in Europe. Surprisingly enough commodities have been drifting lower since QE 2.5 and the Dow is still no where near its October 2007 all-time high.
Depending on who you ask the world’s central banks have created anywhere from US $7 trillion to US $21 trillion and yet the Dow can’t make a new high, commodities prices have been declining for at least eight months on average and the housing sector is no where near a recovery. History will show that there is a big difference between printing money and creating credit. Growth and inflation can only come about when both are present. Increasing the money supply without giving people access to that money through easy credit will not produce inflation, and in today’s world of draconian EU policies, will produce significant deflation. We are seeing that now as commodities prices fall:
COMMODITY 2111 2012 % INCREASE
Oil 114.83 103.96 -9.5%
Copper 4.64 3.64 -21.5%
Corn 7.80 6.14 -21.2%
Soybeans 14.40 14.40 0%
Gasoline 3.41 3.11 -8.8%
Sugar 33.10 21.97 -33.6%
Lumber 319.00 271.00 -15.1%
I didn’t just choose these commodities either; I could have easily listed coffee, OJ, wheat or a handful of other items that we use everyday. Meanwhile the US dollar was almost unchanged during this period, moving from 78.98 in mid-February 2011 to 79.26 on Friday, so the decline has nothing to do with a “stronger dollar”.
In particular if you believe all the projections for renewed growth in the US and Asia then it’s very difficult to understand why oil refuses to move higher:
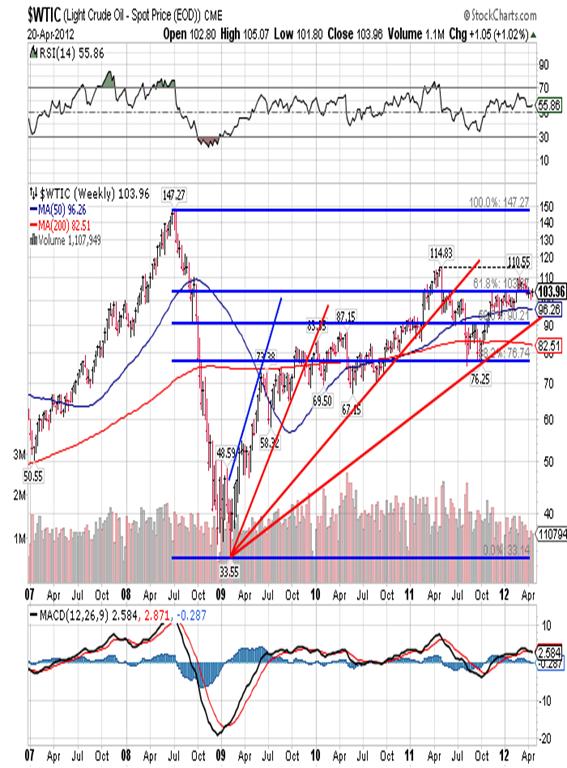
Throw in political uncertainties in Iran, Iraq, Egypt and Syria and you would think that the price of oil would be flying, but it’s not. It can’t seem to pull away from good resistance at 103.80. Also, the same holds true for copper:
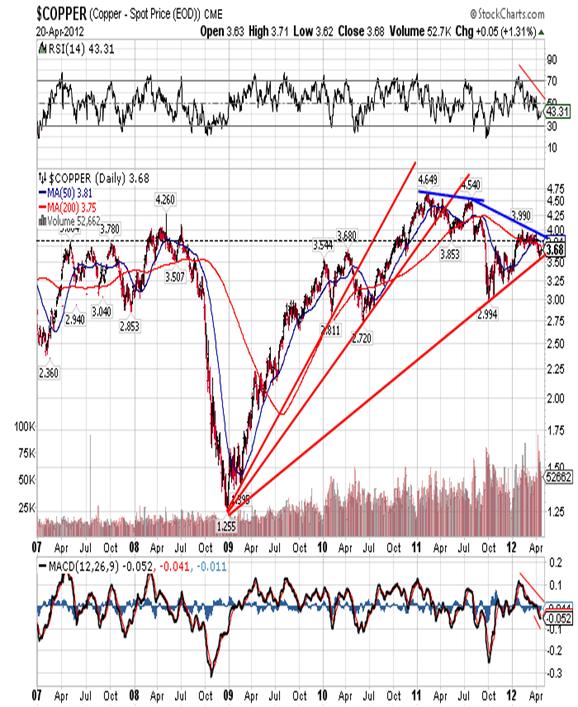
“Dr. Copper” is used in just about everything and is a good indicator of future growth. Right now it’s telling us that things aren’t so great as it is very close to breaking below another fan line.
Finally, what seems to be aggravating the situation even more is Europe’s abysmal management of their economic problems combined with the Fed’s unwillingness to come out and say that QE3 is necessary. It appears that they want things in Europe to unravel so they can blame the EU for QE3, saying that things would have been just fine if Europe hadn’t ruined the party. Nothing could be further from the truth but it sounds good in the papers. For my part I am short oil, copper, wheat, corn, sugar, coffee, OJ and on occasion silver. I am also short the Dow but that is a recent move and it is a small position. My only long position is gold as it remains range bound (1,620 to 1,690), and I will not change unless that range is violated. We have the Fed meeting this week and I don’t expect anything new so that can only benefit my position. Sooner or later the Fed will have to ease, but I think that’s 30 to 90 days away so there is time to let the positions work.Giuseppe L. Borrelli
www.unpuncturedcycle.com
theunpuncturedcycle@gmail.com
Copyright © 2012 Giuseppe L. Borrelli
- All Rights Reserved Disclaimer: The above is a matter of opinion provided for general information purposes only and is not intended as investment advice. Information and analysis above are derived from sources and utilising methods believed to be reliable, but we cannot accept responsibility for any losses you may incur as a result of this analysis. Individuals should consult with their personal financial advisors.
© 2005-2022 http://www.MarketOracle.co.uk - The Market Oracle is a FREE Daily Financial Markets Analysis & Forecasting online publication.