


Silver Uncertain Breakout Direction
Commodities / Gold and Silver 2012 Apr 23, 2012 - 12:59 PM GMTBy: Clive_Maund

 Is silver becoming a bearmarket, or is a bottom pattern completing that will lead to a major new uptrend soon? That is the big conundrum facing investors and speculators in the sector and in this update it will become apparent that the situation must resolve itself with a decisive move soon, one way or the other.
It is very hard to call the direction of the breakout and next big move, because on the one hand a Head-and-Shoulders bottom pattern appears to be completing in silver (and a Head-and-Shouders continuation pattern in gold) but on the other it looks like the dollar's larger uptrend may be about to resume. The situation is extremely finely balanced and the market appears to be waiting on critical fundamental developments - we know that the general background situation is hugely inflationary due to all the money printing in Europe and the US and elsewhere, which is of course a strongly bullish influence on Precious Metals, but at the same time the sovereign debt crisis in Europe is bubbling up again and threatening to derail the frail and stimulus induced economic recovery, and if it does and they fail to quickly regain control of the situation markets can be expected to tank. The current state of unstable equilibrium in the markets regarding these 2 major conflicting infuences is the reason for the standoff of recent weeks, and those who are familiar with "Catastrophe Theory" will readily understand why this is situation that break either way, probably depending on whether the European crisis can be contained.
Just because you don't know which way a market is going to break doesn't mean that you can't position yourself to either protect your holdings in the event of a move against you, or to make substantial gains when the market does finally show its hand. For as we will soon see with a big move likely imminent after a tightening standoff, support and resistance are nearby and well defined, enabling us to set close stops, and this is actually one of those rare times when more experienced traders can position themselves to benefit from an upcoming big move by means of straddle options etc, which do not require a judgement on which direction the move will be in.
The 2-year chart for silver still looks moderately positive with a large Head-and-Shoulders bottom looking like it has formed following the descent from the peak last September. Support is close at hand with the price looking like it is now marking out the Right Shoulder low - if it is we are clearly at a good entry point here. In contrast to gold, silver's moving averages are in bearish alignment as a result of its having fallen much more in percentage terms from its highs. The MACD indicator shows silver to be a little oversold.
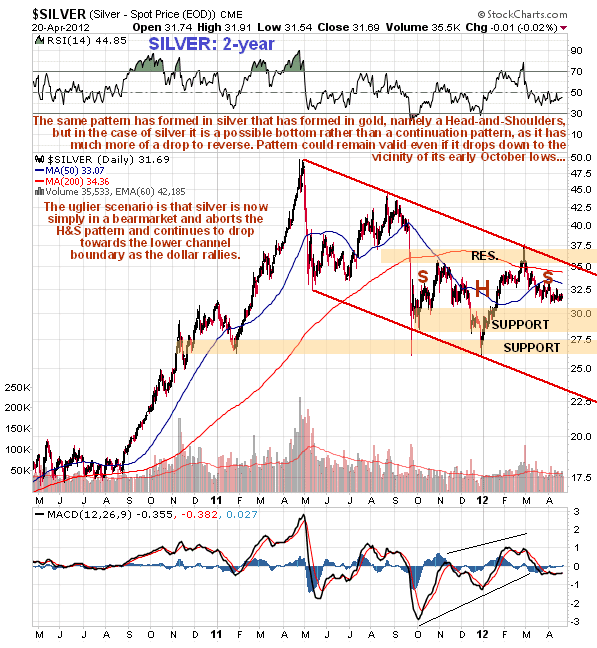
The more pessimistic scenario is that the apparent Head-and-Shoulders bottom is a phoney and that silver will go on to break below the 2 support levels shown and head towards the lower boundary of the downtrend in force from last April - May, and possibly breach the lower boundary of the channel. This is a development that we can expect to ensue if the dollar index breaks out above 80 to embark on another substantial upleg. The MACD indicator shown at the bottom of the chart reveals a momentum breakdown that increases the risk of such a move.
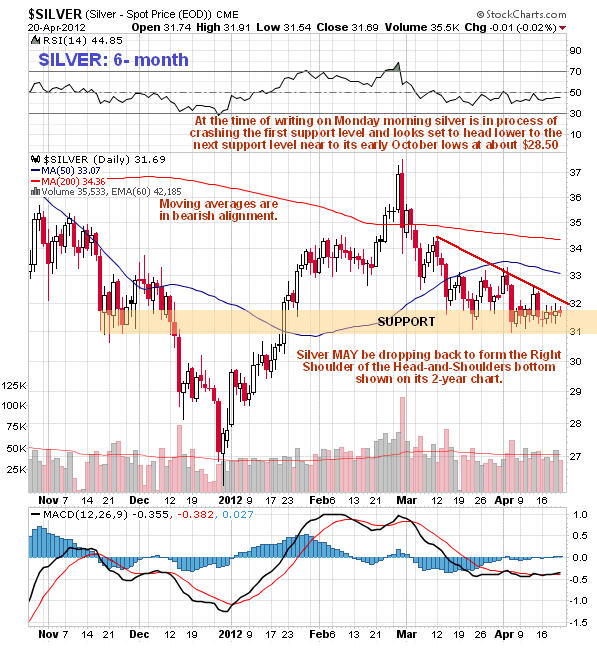
The 6-month chart for silver shows that it has found support at and above $31 in recent weeks, but it has been put under increasing pressure from the falling downtrend line shown that has forced this morning's breakdown, although the breakdown is as yet not decisive and the immediate outlook will depend on how silver closes today. The Head-and-Shoulders bottom pattern will remain a viable scenario even if it drops down to its Left Shoulder lows shown on the 2-year chart which occurred early last October at about $28.50, but if it continues below that it will spoil the pattern.
Resolution of the pattern completing in silver will depend very much on which way the dollar index breaks from its Triangle. The outlook for the dollar is discussed in the parallel Gold Market update to which you are referred, but in summary the prospects for the dollar depend on whether the debt situation in Europe gets out of control and eclipses the otherwise strongly bullish (for Precious Metals) massive money creation in Europe, the US and eslewhere.
By Clive Maund
CliveMaund.com
For billing & subscription questions: subscriptions@clivemaund.com
© 2012 Clive Maund - The above represents the opinion and analysis of Mr. Maund, based on data available to him, at the time of writing. Mr. Maunds opinions are his own, and are not a recommendation or an offer to buy or sell securities. No responsibility can be accepted for losses that may result as a consequence of trading on the basis of this analysis.
Mr. Maund is an independent analyst who receives no compensation of any kind from any groups, individuals or corporations mentioned in his reports. As trading and investing in any financial markets may involve serious risk of loss, Mr. Maund recommends that you consult with a qualified investment advisor, one licensed by appropriate regulatory agencies in your legal jurisdiction and do your own due diligence and research when making any kind of a transaction with financial ramifications.
Clive Maund Archive |
© 2005-2022 http://www.MarketOracle.co.uk - The Market Oracle is a FREE Daily Financial Markets Analysis & Forecasting online publication.