


Gold's Next Big Move, Which Direction?
Commodities / Gold and Silver 2012 Apr 23, 2012 - 12:55 PM GMTBy: Clive_Maund

 Is a top of some significance forming in gold, or is a consolidation pattern completing that will lead to a major new uptrend soon? That is the big conundrum facing investors and speculators in the sector and in this update it will become apparent that the situation must resolve itself with a decisive move soon, one way or the other.
It is very hard to call the direction of the breakout and next big move, because on the one hand a Head-and-Shoulders continuation pattern appears to be completing in gold (and a Head-and-Shouders bottom in silver) but on the other it looks like the dollar's larger uptrend may be about to resume. The situation is extremely finely balanced and the market appears to be waiting on critical fundamental developments - we know that the general background situation is hugely inflationary due to all the money printing in Europe and the US and elsewhere, which is of course a strongly bullish influence on Precious Metals, but at the same time the sovereign debt crisis in Europe is bubbling up again and threatening to derail the frail and stimulus induced economic recovery, and if it does and they fail to quickly regain control of the situation markets can be expected to tank. The current state of unstable equilibrium in the markets regarding these 2 major conflicting infuences is the reason for the standoff of recent weeks, and those who are familiar with "Catastrophe Theory" will readily understand why this is situation that break either way, probably depending on whether the European crisis can be contained.
Just because you don't know which way a market is going to break doesn't mean that you can't position yourself to either protect your holdings in the event of a move against you, or to make substantial gains when the market does finally show its hand. For as we will soon see with a big move likely imminent after a tightening standoff, support and resistance are nearby and well defined, enabling us to set close stops, and this is actually one of those rare times when more experienced traders can position themselves to benefit from an upcoming big move by means of straddle options etc, which do not require a judgement on which direction the move will be in.
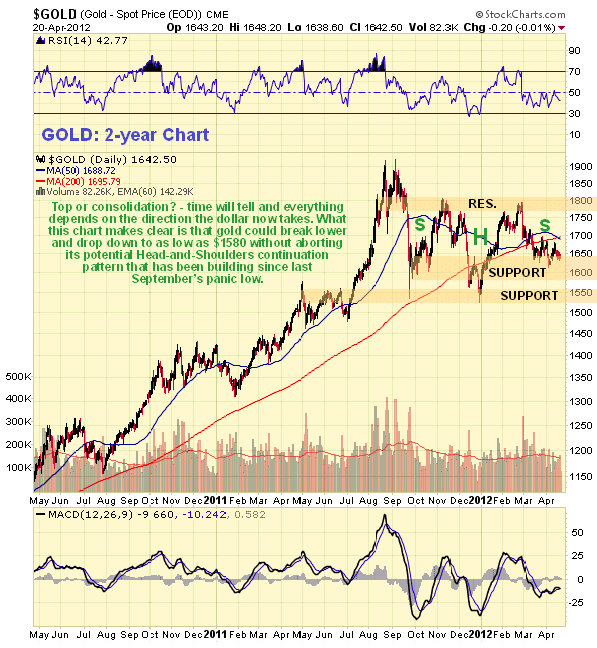
The 2-year chart for gold still looks quite positive with a large Head-and-Shoulders continuation pattern looking like it has formed following the descent from the peak last September. Support is close at hand with the price looking like it is now marking out the Right Shoulder low - if it is we are clearly at a good entry point here. Moving averages are in reasonably bullish alignment with the 200-day still rising, and renewed advance would quickly turn the 50-day moving average. The MACD indicator shows gold to be somewhat oversold here.
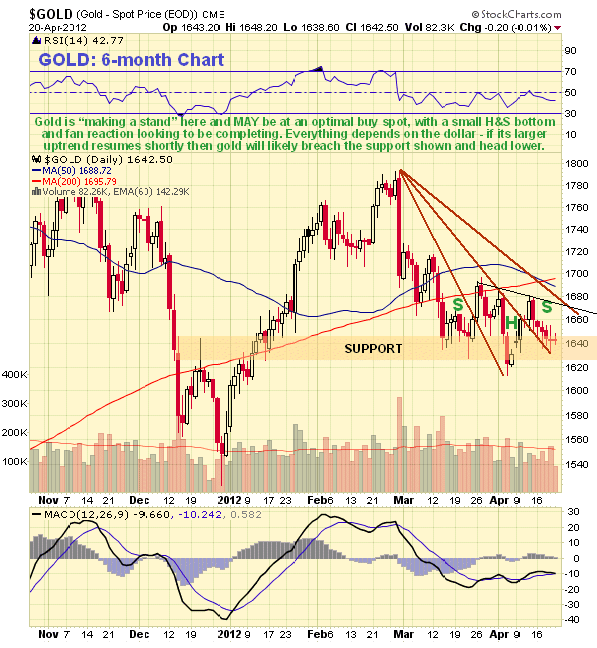
The 6-month chart shows that gold is finding support here and appears to be marking out a mini Head-and-Shoulders bottom above the support at the Left Shoulder lows of last September. The recent decline has decelerated with a bullish fan pattern evident. As we will later see when we look at the dollar chart, if the dollar's major uptrend fails soon then gold and silver should take off higher from here, but if it doesn't and it instead takes off higher gold is likely to breach nearby support and head lower, but here we should note that if it does it could drop to about $1580 without aborting its Head-and-Shoulders continuation pattern.
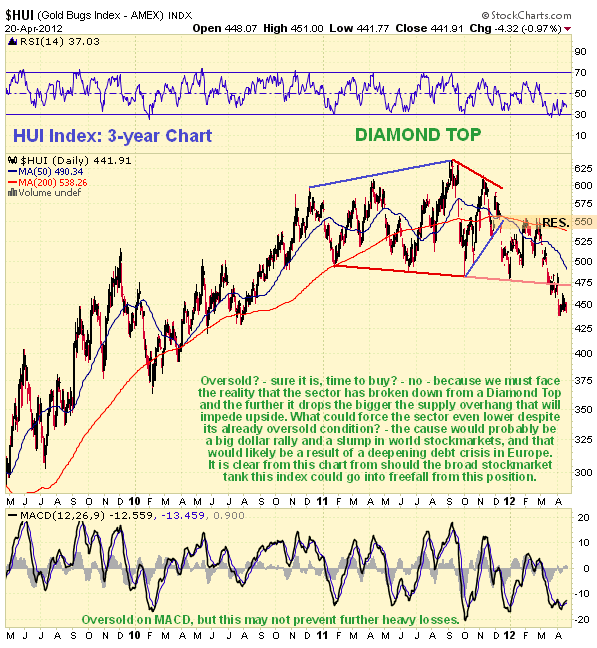
While gold's chart still looks reasonably OK, it has to be admitted that the PM stock index charts look terrible, an example being the 3-year chart for the HUI index shown below. While it is certainly true that stocks are now quite heavily oversold there remains a lot of downside risk, as the HUI index is now dropping away from the Diamond Top from which it recently broke down - it is clear that in adverse market conditions it could easily go into freefall, and the further it drops from the top pattern, the bigger will be the supply overhang from distressed holders wanting to get out as near to even as possible and thus impeding any subsequent rally. This chart, which is extraordinarily weak comparted the the metals themselves, implies that the broad market is soon going to be in serious trouble.
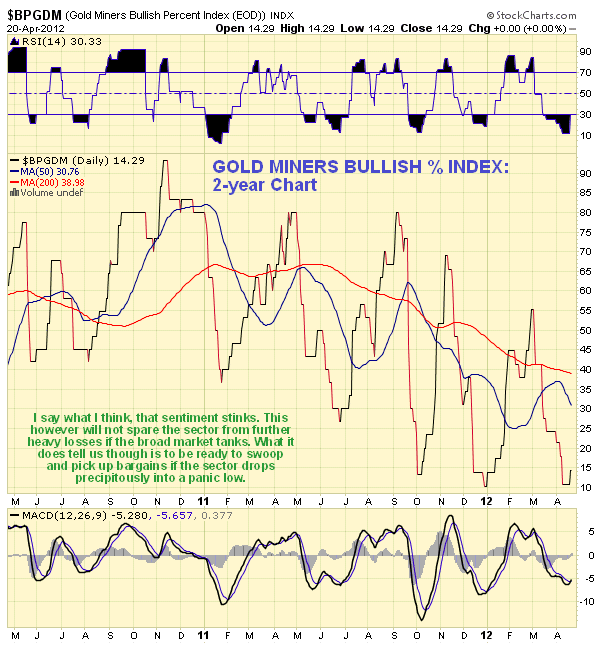
Sentiment towards the PM sector is undeniably awful, as the chart below for the Gold Miners bullish percent index shows - it is at such low levels that readings like this would normally embolden us to step forward and buy. However, it would a shame to do so just before a vertical plunge. Where this chart is very useful is that it makes it clear that if the sector does accelerate to the downside into a vertical drop, we should be ready to swoop on the incedible bargains that will then exist, as it should mark the final low.
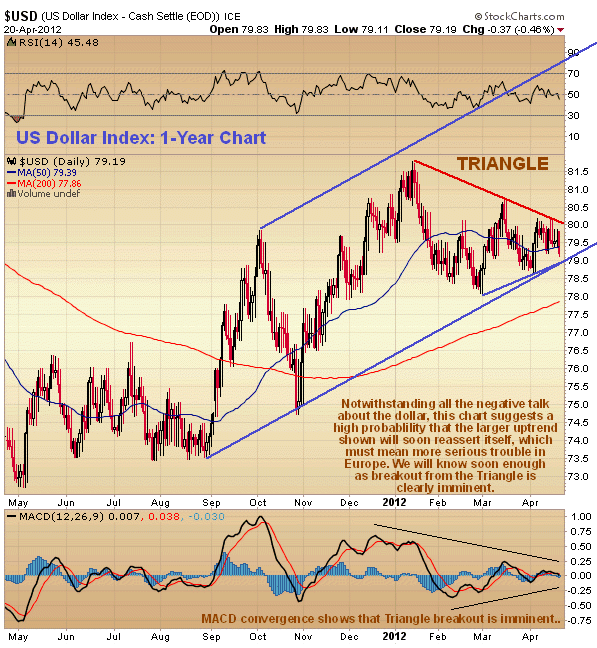
Now we turn to the crucial deciding factor - the direction of the dollar. The dollar index has been stuck in a Triangular holding pattern for 3 months now following its strong gains from late October through mid-January, as we can see on its 1-year chart below. We can also see that the larger uptrend that began late last August is still in force and must be presumed to remain so unless and until it breaks down from it, especially as moving averages are in quite strongly bullish alignment. By itself this chart does not bode well for the PM sector, or for the stockmarket. There is an argument going around that the dollar and gold could advance together, on the basis that all fiat currencies are going down the drain in lockstep, and that with Europe imploding both will acquire safe haven status, at least temporarily. However, there can be little doubt that if the dollar rallies strongly gold would be hard put to advance expressed in dollars, as it would be "trying to swim upriver", and the argument is not thought to hold water for another reason, which is that if markets crash due to the european crisis getting out of control, investors will indulge in their time honored practice of "throwing out of the baby with the bathwater" and dump everything over the side willy-nilly as usual.
Adam Hamilton´s view that the 2008 market meltdown was a once in a lifetime event would be considered to be correct if the issues generating that crisis had been squarely faced up to and dealt with, but as we know they haven't - they have been swept under the rug, with central bankers worldwide having embarked on a drunken orgy of money creation motivated by short-term expediency, and banks and governments conniving to push the bill for the entire mess off onto the ordinary citizen and taxpayer via rampant inflation and austerity measures. The problem with all of this is that impoverishing the ordinary citizen is going to have severe consequences in the form of reduced tax revenes and economic activity, which means that whichever way you cut it we are headed towards recession/depression whose ultimate purpose is to wipe the slate clean. It might not affect the banks, who are able to create money out of thin air and then charge people 5% to borrow it, while their rate is near zero, but it will affect the rest of the economy - after all, elementary economics dictates that if people stop buying stuff then corporate profits drop, do they not? Thus, stockmarkets have a reason to fall that is quite distinct from the impact of a european implosion, although they could hold up nominally in an environment of roaring inflation.
In conclusion, the next big move in gold and silver looks like it is going to be decided by which way the dollar breaks in the near future. Let's watch that closely now.
There's an old saying that "hope springs eternal in the human breast" and people do need to have something to hold on to while everything else is falling apart. For investors that something might be the stock of Apple Inc, and if you want assistance in deciding on the chances of it holding up while everything else is going down the drain, have a read of Is Apple Inc about to become a faller??
By Clive Maund
CliveMaund.com
For billing & subscription questions: subscriptions@clivemaund.com
© 2012 Clive Maund - The above represents the opinion and analysis of Mr. Maund, based on data available to him, at the time of writing. Mr. Maunds opinions are his own, and are not a recommendation or an offer to buy or sell securities. No responsibility can be accepted for losses that may result as a consequence of trading on the basis of this analysis.
Mr. Maund is an independent analyst who receives no compensation of any kind from any groups, individuals or corporations mentioned in his reports. As trading and investing in any financial markets may involve serious risk of loss, Mr. Maund recommends that you consult with a qualified investment advisor, one licensed by appropriate regulatory agencies in your legal jurisdiction and do your own due diligence and research when making any kind of a transaction with financial ramifications.
Clive Maund Archive |
© 2005-2022 http://www.MarketOracle.co.uk - The Market Oracle is a FREE Daily Financial Markets Analysis & Forecasting online publication.