


U.S. Housing Market Sector – Why the Fed Depicts it as "Depressed"
Housing-Market / US Housing Apr 21, 2012 - 12:33 PM GMTBy: Asha_Bangalore

 The National Association of Realtors published existing home sales data for March; it was down. But, the strength of January home sales gave a lift to the quarterly read. Housing starts data for March show a drop in new homebuilding activity but the first quarter average shows a gain of 10.5%. New home sales numbers will be published on April 24. Sales of new homes fell in January and February, a sharp increase in March sales will be necessary to give a boost to the quarterly average. These numbers need to be viewed in a historical context to evaluate the current status of the housing sector.
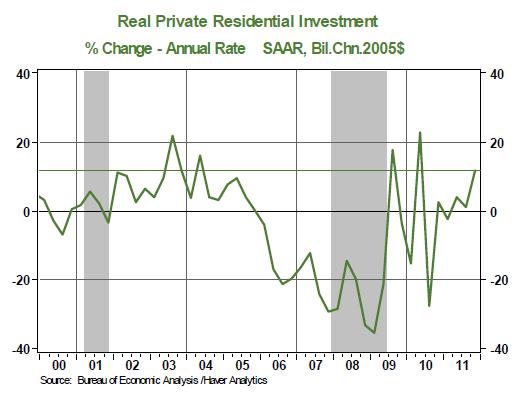
The housing sector’s activity – homebuilding, commissions from sales of homes, renovations – is captured in the GDP report as residential investment expenditures. Residential investment expenditures during the fourth quarter grew at an annual rate of 11.7%, the strongest performance since the second quarter of 2004 (see Chart 1) excluding the temporary spikes in 2009 and 2010 that were related to the first-time homebuyer program.
Chart 1
Historically, residential investment expenditures have led economic recoveries and posted strong gains in the early stages of a recovery. This time around, the situation is markedly different, with residential investment expenditures recording the weakest performance since 1960.
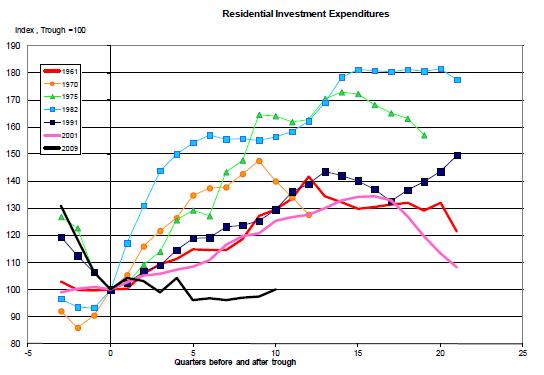
Chart 2 is an index chart where the level of residential investment expenditure in each business cycle is set to 100 at the trough of each cycle. A reading of 102 would mean that residential investment expenditures have advanced 2.0% from the trough and 99 would stand for a 1.0% decline from the trough. Residential investment expenditures in the fourth quarter of 2011 have managed to only match the level posted at the trough of the current business cycle, which is worrisome because this poor performance comes after ten quarters of economic growth. By stark contrast, in each of the previous six business cycles, residential investment expenditures had risen between 25% and 64% from the trough following ten quarters of business expansion (see Chart 2). The sub-par performance of the housing sector has far-reaching adverse economic ramifications and it has essentially translated into overall slow economic growth.
Despite historically low mortgage rates and attractive home prices, the soft demand for homes is due to lackluster employment conditions. The “labor market” holds the key to the outlook of the housing sector, which is well known. Chart 2 justifies the Fed’s description of the housing sector as “depressed” in the monetary policy statement of not only March 13, 2012, but also several prior statements. Stay tuned for the Fed’s latest take on the housing market when the April 25 policy statement is published.
Chart 2
Asha Bangalore — Senior Vice President and Economist
http://www.northerntrust.com
Asha Bangalore is Vice President and Economist at The Northern Trust Company, Chicago. Prior to joining the bank in 1994, she was Consultant to savings and loan institutions and commercial banks at Financial & Economic Strategies Corporation, Chicago.
Copyright © 2012 Asha Bangalore
The opinions expressed herein are those of the author and do not necessarily represent the views of The Northern Trust Company. The Northern Trust Company does not warrant the accuracy or completeness of information contained herein, such information is subject to change and is not intended to influence your investment decisions.
© 2005-2022 http://www.MarketOracle.co.uk - The Market Oracle is a FREE Daily Financial Markets Analysis & Forecasting online publication.